
521 Rivella Vista Dr
Redding, CA 96001
$399,900
3 bd · 2 ba · 1,750 sqft · Listed today
View on Realtor.com →Year built
1984
Sqft
1,750
Lot sqft
10,019
HOA / mo
$0
Furnished
No
List date
2026-11-13T08:17:08.000000Z
Revenue
Annual revenue
$37,854
ADR
$199
Occupancy
52%
Cleaning fees (12 mo)
$4,599
Confidence
Low (28.47), 7 comps
Comp revenue range (p25 / median / p75)
Median revenue of shown comps: $25,652
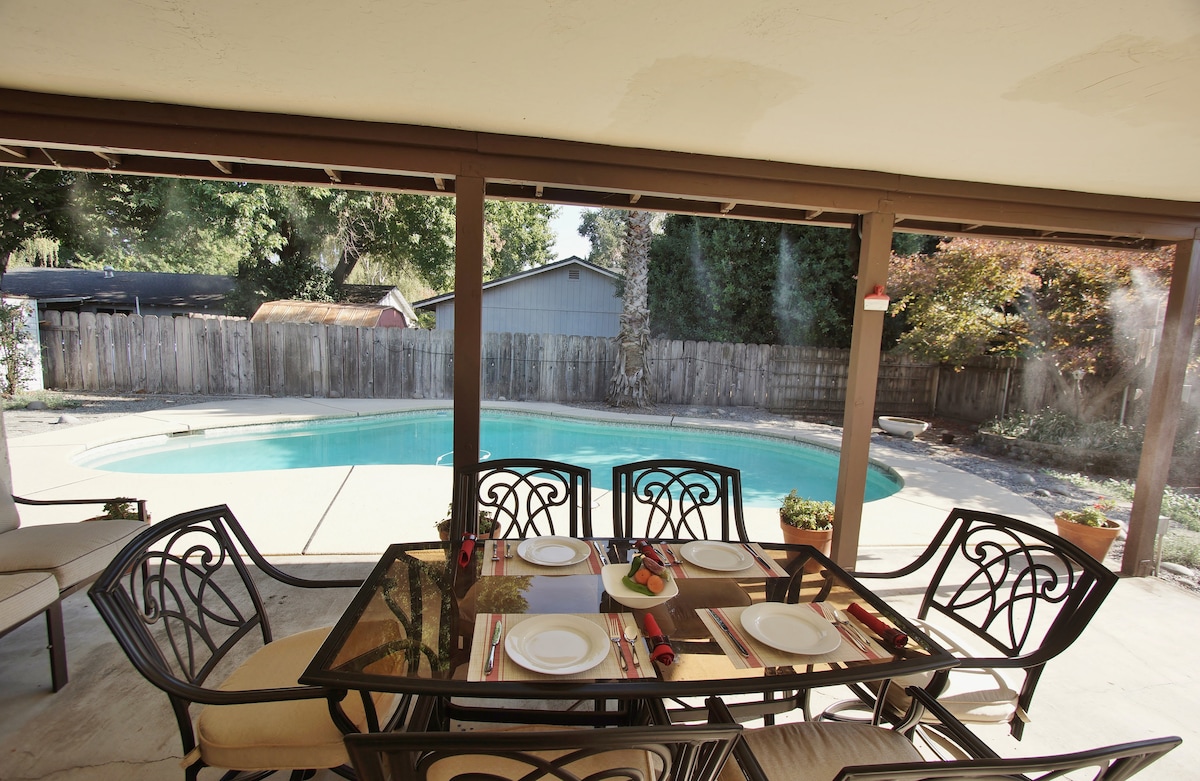

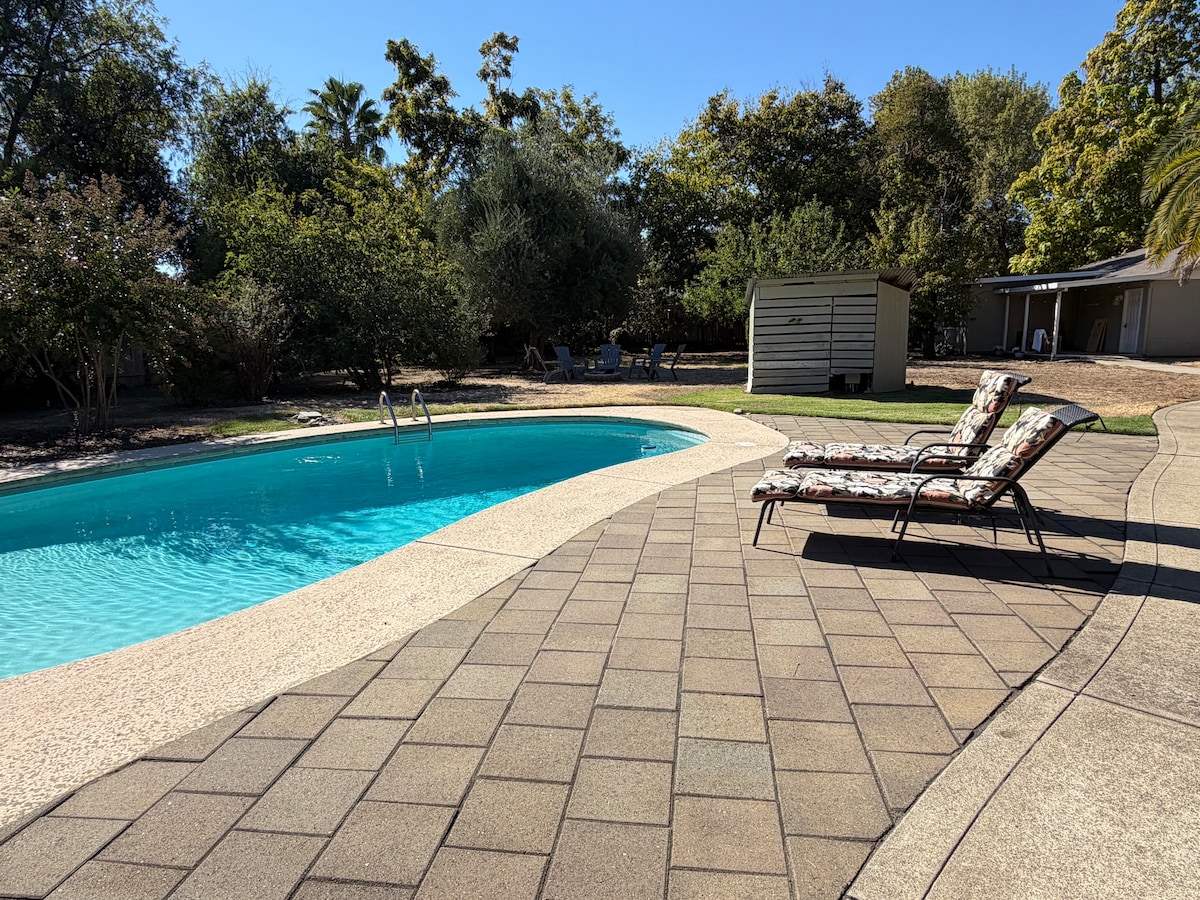
Rest and Rejuvenate
House · 3 bd · 2 ba · sleeps 6 · 0.3 mi
- Pool
- A/C
- Free parking
- Wifi
- +1
Revenue $5,059ADR $163Occ ≈ 9%4.8★ (5)
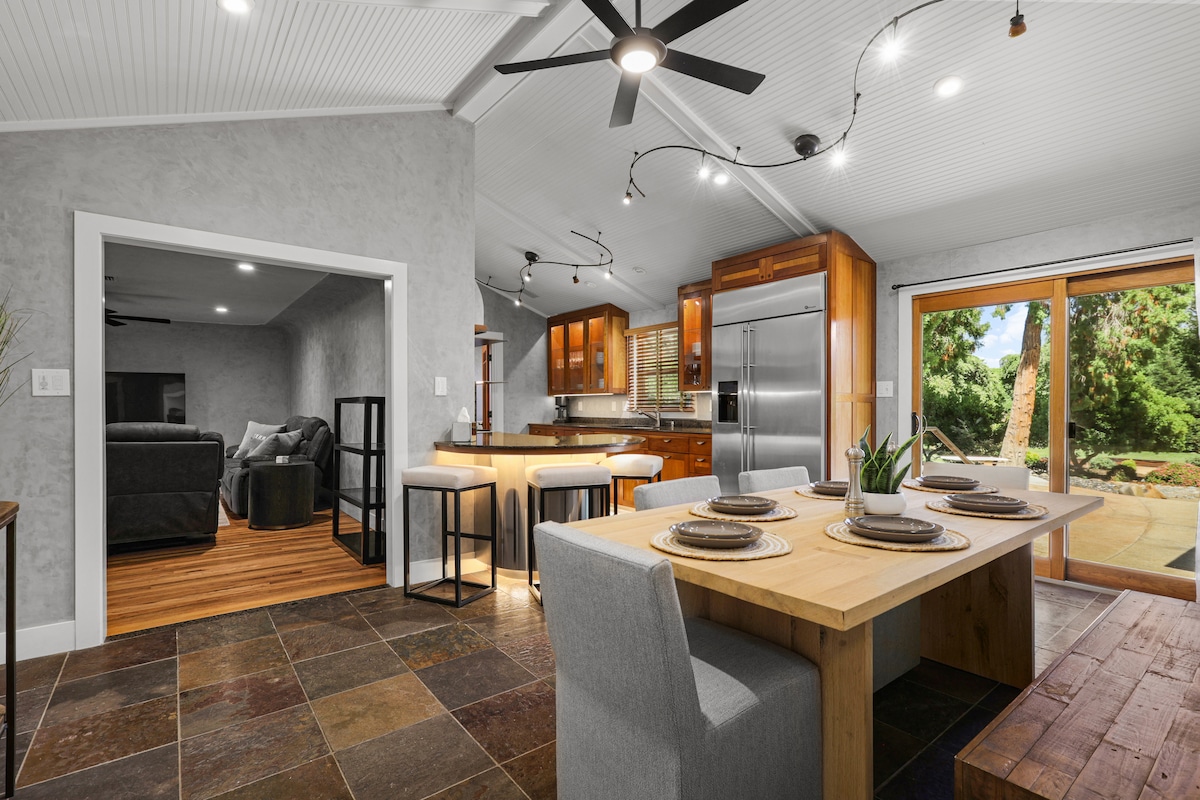
The Wilshire House-Redding, Ca
House · 3 bd · 2 ba · sleeps 6 · 0.4 mi
- Pool
- A/C
- Free parking
- Wifi
- +2
Revenue $15,832ADR $298Occ ≈ 15%5★ (9)
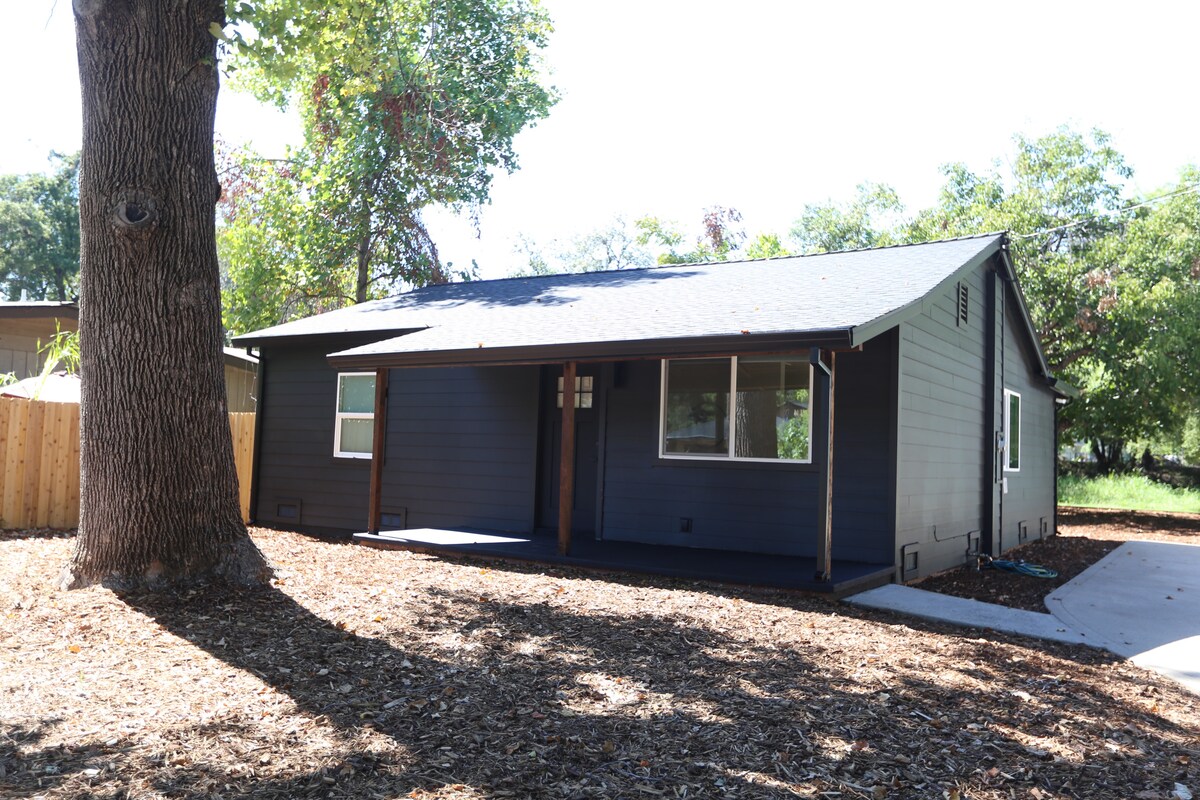
Newly Renovated Modern Home
House · 3 bd · 1 ba · sleeps 6 · 0.6 mi
- A/C
- Free parking
- Wifi
- Kitchen
- +1
Revenue $18,371ADR $82Occ ≈ 61%—
| Listing | Size | Revenue (12 mo) | ADR | Occ ≈ | Rating | Distance | Links |
|---|---|---|---|---|---|---|---|
The Pineapple House *Best Reviews* Private Pool! House
| 3 bd · 2 ba · sleeps 6 | $57,868 | $328 | 48% | 5★ (314) | 0.2 mi | AirbnbVrbo |
~Rest and Refresh~ House
| 3 bd · 1 ba · sleeps 6 | $38,709 | $162 | 65% | 4.8★ (405) | 0.3 mi | AirbnbVrbo |
Rest and Rejuvenate House
| 3 bd · 2 ba · sleeps 6 | $5,059 | $163 | 9% | 4.8★ (5) | 0.3 mi | Airbnb |
The Wilshire House-Redding, Ca House
| 3 bd · 2 ba · sleeps 6 | $15,832 | $298 | 15% | 5★ (9) | 0.4 mi | Airbnb |
Newly Renovated Modern Home House
| 3 bd · 1 ba · sleeps 6 | $18,371 | $82 | 61% | — | 0.6 mi | Airbnb |
Riverfront Redding Retreat | Fireplace, AC, WiFi House
| 3 bd · 2 ba · sleeps 6 | $32,932 | $188 | 48% | 4.9★ (8) | 0.7 mi | AirbnbVrboBooking |
Revenue and nightly rate (ADR) are trailing-12-month figures per listing. Occupancy is estimated as revenue ÷ ADR ÷ 365 and can read high when revenue includes cleaning fees.
Cash flow calculator
Est. revenue
$37,854
NOI
$16,317
Cash flow /mo
$1,360
Cash needed
$435,396
Cash-on-cash (all cash)
3.7%
ROE (yr 1)
6.5%
Cap rate
4.1%
DSCR
—
Year-1 write-off
$107,915
Year-1 tax shield @ 32%
$34,533
Year-1 return on equity
- Cash flow (annual)$16,317
- Principal paydown (n/a, cash)$0
- Appreciation at%$11,997
Tax savings aren't counted. Turn on “Count tax savings in returns” above if you can use the losses.
Opex, cash-needed & tax-savings breakdown
Annual operating expenses
- Management (20% of revenue)$7,571
- Platform fees (3% of revenue)$1,136
- Maintenance / capex (5% of revenue)$1,893
- Utilities & supplies$4,200
- HOA$0
- Property tax$4,999
- Insurance (STR-rated)$2,339
Cash needed to close
- Purchase price (all cash)$399,900
- Closing costs (4.0%)$15,996
- Furnishing (bought new)$19,500
Tax savings if the STR loophole applies
- Tax shield @ 32%$34,533
Property tax, insurance rate and the land/building split come from this listing's county tax record; other assumptions match the daily feed (see tasks/plan.md).
The write-off comes from the cost segregation estimate below. Not tax advice.
Cost segregation estimate
An estimate from the listing: every part of the home is priced from national construction costs, less wear for age, and the price (less land) is spread over the parts in proportion. The headline is what a typical cost seg study would claim for this property. The answers below are optional refinements.
Depreciable basis
$347,000
Short-life (5/15-yr)
$88,000 · 25%
Year-1 deduction
$108,000
Year-1 tax shield @ 32%
$35,000
Land 13% (county tax record, assessed value split) · building $258,000 over 39 years · new furniture $20,000
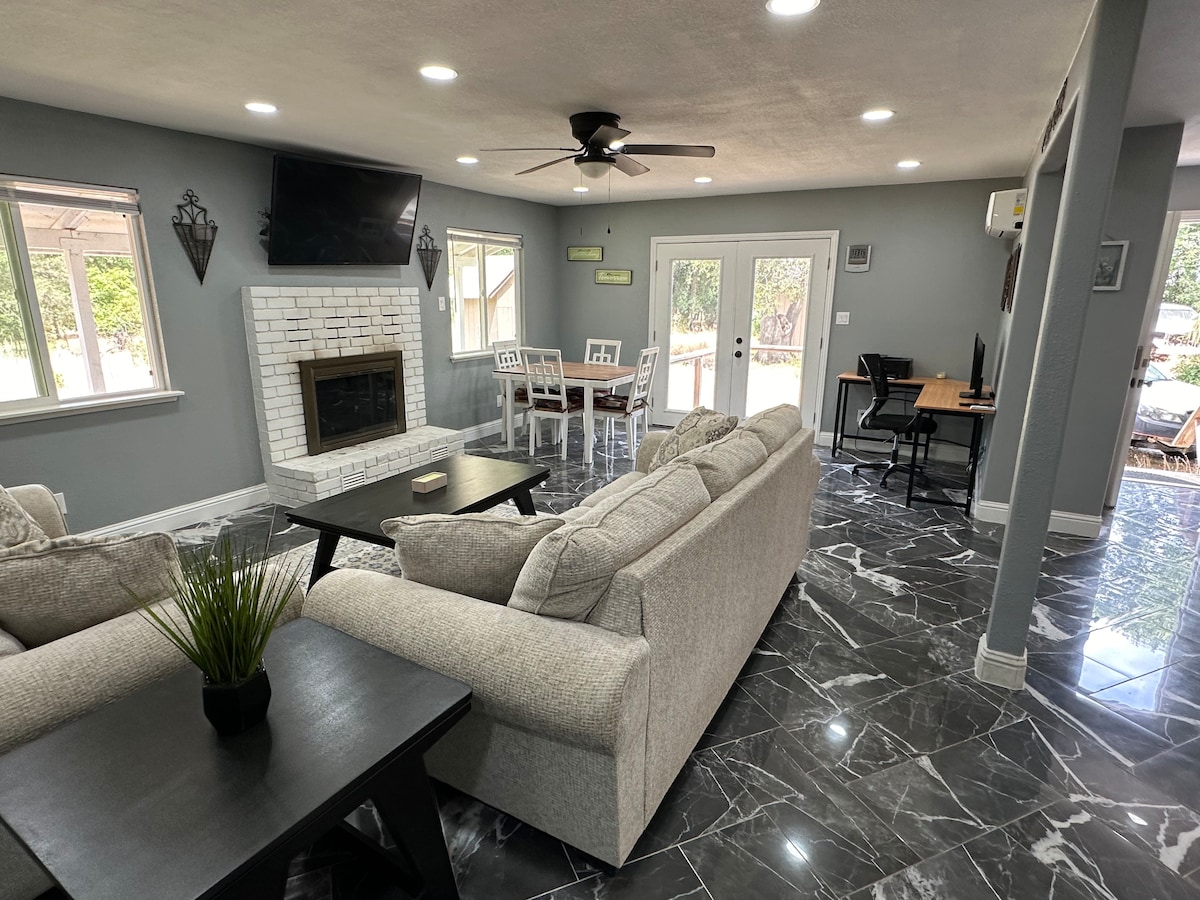
Based on: 1,750 sq ft, built 1984, 3 bd / 2 ba, unfurnished, listing features (patio, fireplace, stone counters, flooring types).
Try the cost segregation calculator on any property →
IRS-guide safe-harbor floor: $82,000 in year 1 (18% short-life, $26,000 tax shield), the conservative amount following the IRS audit guide's residential classification table.
- $9,700
Kitchen cabinetsdefault
$9,600 new × 40% good × 2.52 allocation
- $9,900
Kitchen countertops (stone)listing
$9,900 new × 40% good × 2.52 allocation
- $3,100
Decorative trimdefault
$3,100 new × 40% good × 2.52 allocation
- $300
Mirrorsdefault
$300 new × 40% good × 2.52 allocation
- $1,200
Shelvingdefault
$1,200 new × 40% good × 2.52 allocation
- $4,500
Window coverings (18)default
$4,500 new × 40% good × 2.52 allocation
- $5,700
Carpet, vinyl & laminate (50% of floors)listing
$5,600 new × 40% good × 2.52 allocation
- $7,500
Kitchen & laundry equipment plumbingdefault
$7,500 new × 40% good × 2.52 allocation
- $4,600
Kitchen, laundry & data equipment electricaldefault
$4,500 new × 40% good × 2.52 allocation
- $8,200
Appliances (range, microwave, dishwasher, disposal, refrigerator, washer, dryer)default
$8,100 new × 40% good × 2.52 allocation
- $19,500
Furniture bought newlisting
$19,500 new × 100% good · bought separately
- $10,900
Paving: driveway & walks (paved)default
$8,700 new × 50% good × 2.52 allocation
- $10,500
Landscaping (typical)default
$8,300 new × 50% good × 2.52 allocation
- $9,900
Patioslisting
$7,900 new × 50% good × 2.52 allocation
- $2,200
Decks & porches (attached)default
$1,700 new × 50% good × 2.52 allocation
- $190,900
Structure: foundation, framing, walls, windows, doors, roof, interior finishesdefault
$189,700 new × 40% good × 2.52 allocation
- $19,800
Building plumbing & fixturesdefault
$19,700 new × 40% good × 2.52 allocation
- $19,600
Building electrical & lightingdefault
$19,500 new × 40% good × 2.52 allocation
- $19,800
HVACdefault
$19,700 new × 40% good × 2.52 allocation
- $5,700
Hardwood & tile floorsdefault
$5,600 new × 40% good × 2.52 allocation
- $2,600
Fireplacelisting
$2,600 new × 40% good × 2.52 allocation
About the property
Depreciation schedule: typical cost seg study
| Year | 5-yr | 15-yr | Building | Total |
|---|---|---|---|---|
| 1 | $74,200 | $33,500 | $300 | $107,900 |
| 2 | $0 | $0 | $6,600 | $6,600 |
| 3 | $0 | $0 | $6,600 | $6,600 |
| 4 | $0 | $0 | $6,600 | $6,600 |
| 5 | $0 | $0 | $6,600 | $6,600 |
| 6+ | $0 | $0 | $231,700 | $231,700 |
| Total | $74,200 | $33,500 | $258,400 | $366,100 |
Model-based estimate, not an engineered cost segregation study. The IRS doesn’t approve studies; get a professional study before filing. Using these losses against W-2 income needs the short-term rental exception (average stay ≤7 days + material participation). The 39-year building life applies because stays average under 30 days, a separate test (27.5 years for a long-term rental). Federal only: California, Georgia and Wisconsin disallow bonus depreciation, Ohio adds back 5/6 of it, and Tennessee has no personal income tax. Not tax advice.
Market note
Rules differ by jurisdiction. City of Redding caps whole-home vacation rentals at 400 with a 600 ft spacing rule (300 ft with a physical buffer), and its permit is NOT transferable to a new owner. Shasta Lake city and unincorporated Shasta County allow permitted rentals with no cap found, but permits also do not transfer on sale. Lodging tax ~10% plus a 2% tourism assessment in Redding. Verify parcel eligibility with the city or county before you buy.