
1634 Spruce Dr
Sevierville, TN 37876
$639,950
4 bd · 4 ba · 2,464 sqft · Listed 2d ago
View on Realtor.com →Year built
1980
Sqft
2,464
Lot sqft
23,087
HOA / mo
$0
Furnished
No
List date
2026-11-17T22:05:43.000000Z
Revenue
Annual revenue
$78,655
ADR
$374
Occupancy
58%
Cleaning fees (12 mo)
$16,313
Confidence
Med (55.16), 26 comps
Comp revenue range (p25 / median / p75)
Median revenue of shown comps: $78,314
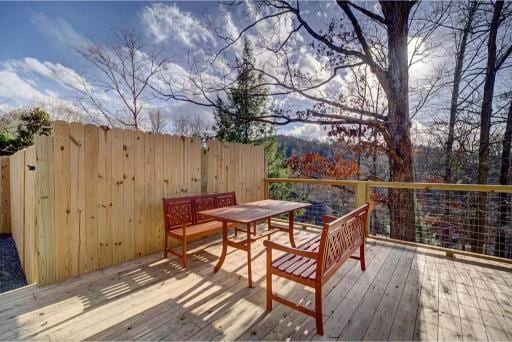
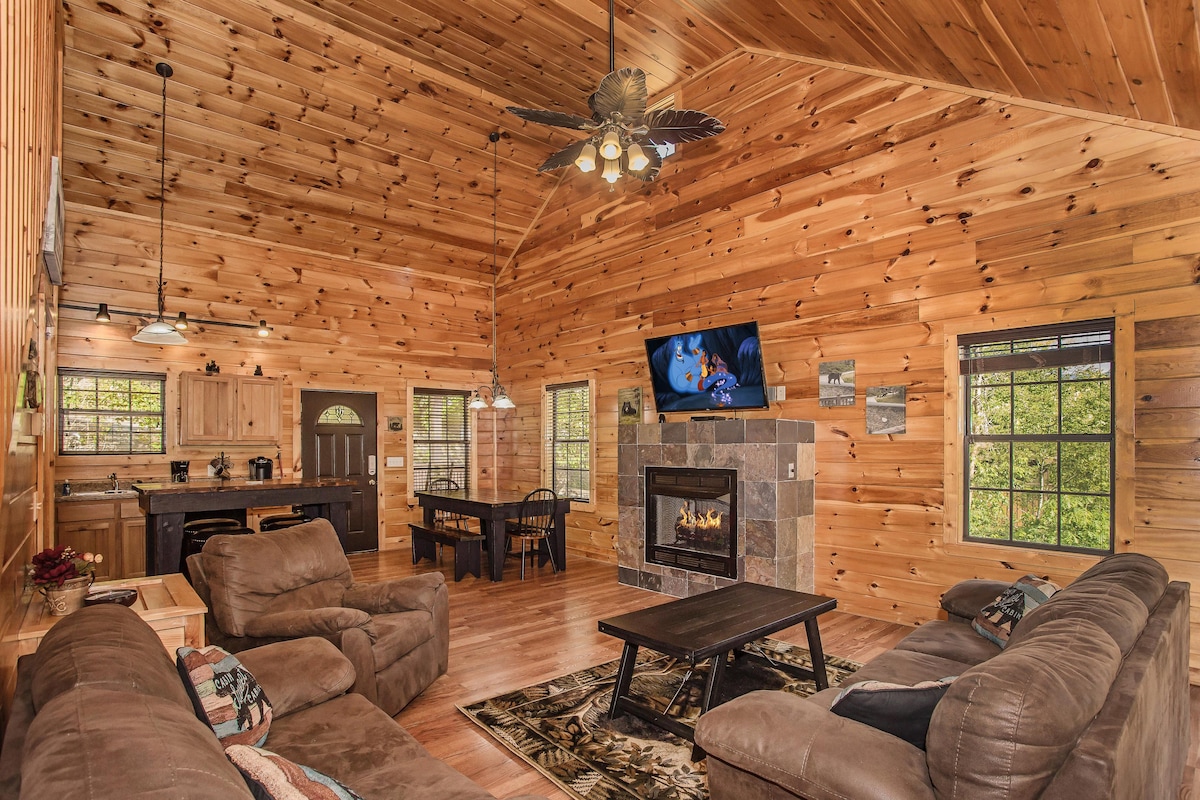

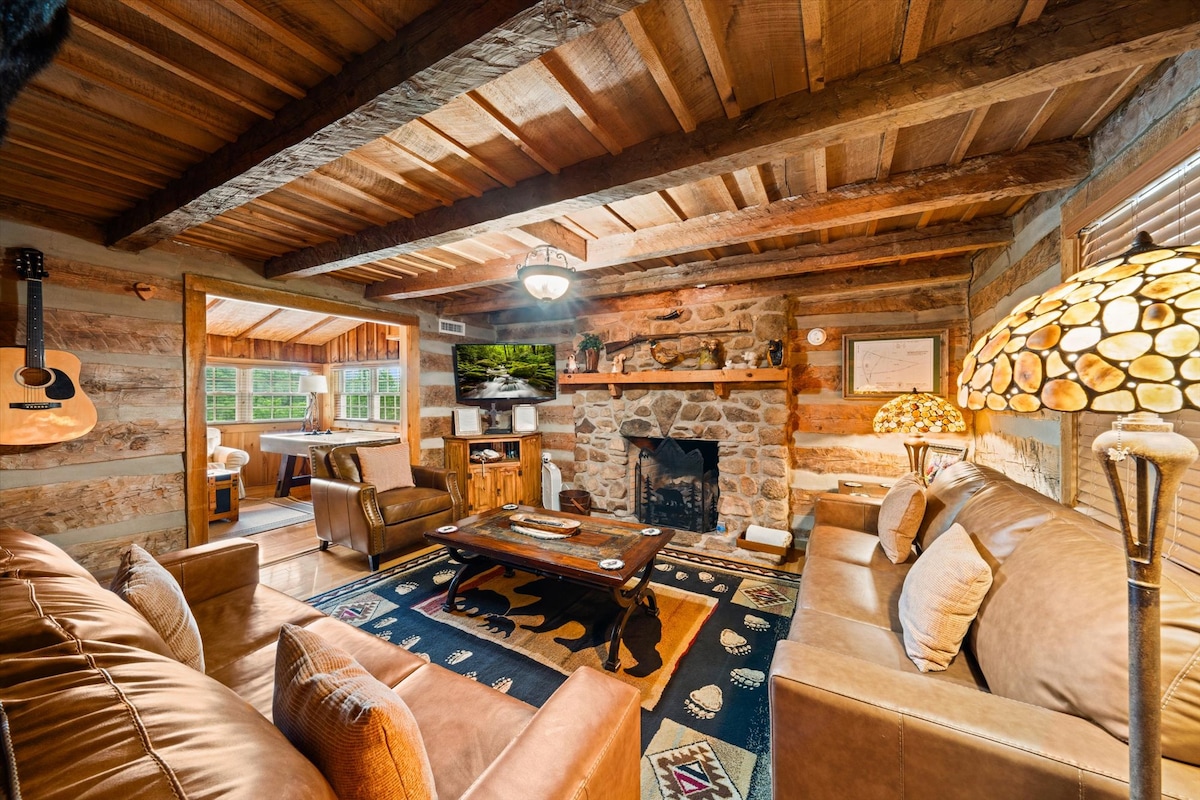

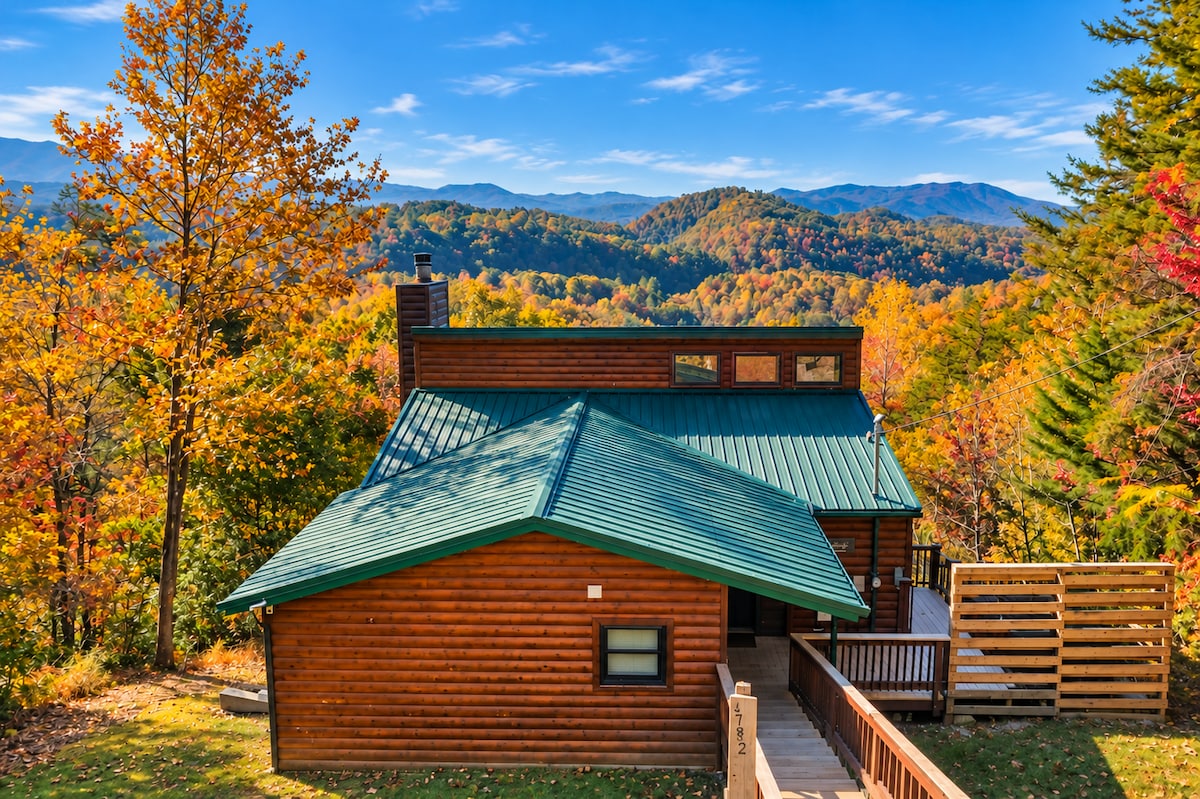
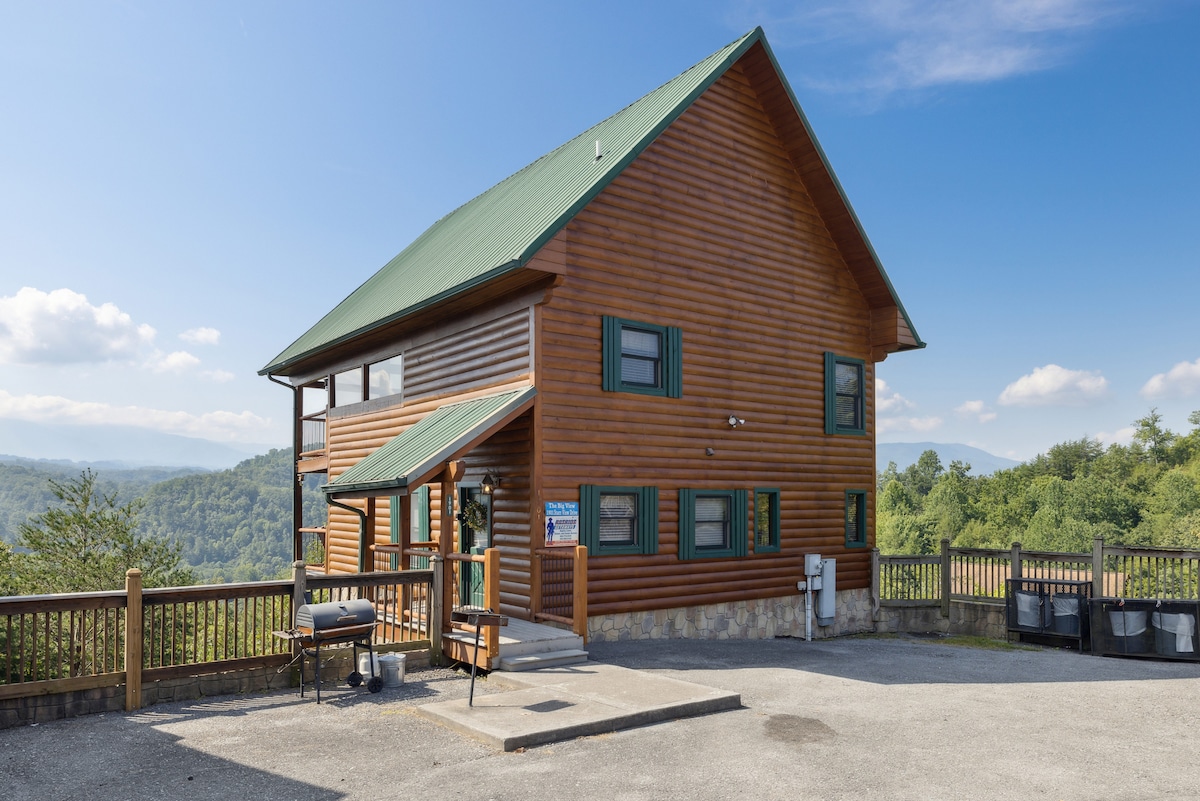
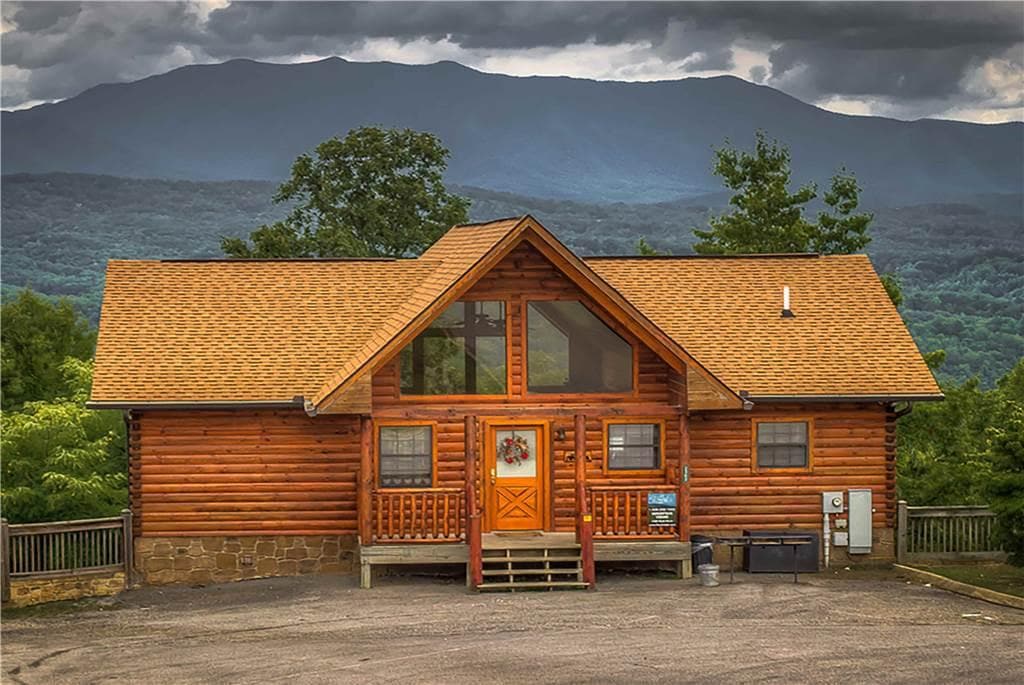
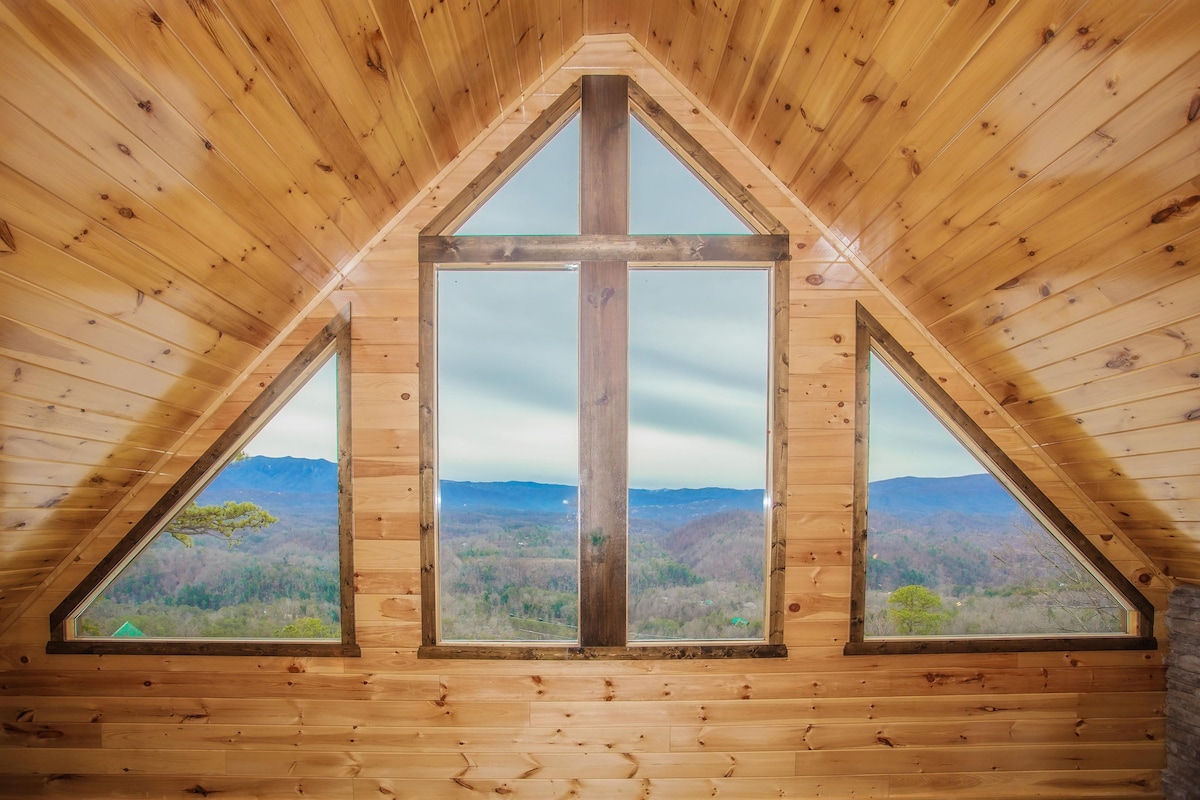
The Big View by American Patriot Getaways
Vacation home · 4 bd · 4 ba · sleeps 10 · 0.4 mi
Revenue $127,396ADR $497Occ ≈ 70%—

| Listing | Size | Revenue (12 mo) | ADR | Occ ≈ | Rating | Distance | Links |
|---|---|---|---|---|---|---|---|
Spacious 4BR Mountain Cabin with Games and Hot Tub Cabin
| 4 bd · 4 ba · sleeps 12 | $68,185 | $359 | 52% | 4.5★ (86) | 39 ft | AirbnbVrboBooking |
A Whole New World: Views*Pets*HotTub*Wifi*Theater Cabin
| 4 bd · 3 ba · sleeps 12 | $59,306 | $454 | 36% | 3.5★ (10) | 0.3 mi | AirbnbVrbo |
10 min to Everything! Firepit, Hot Tub and Private Cabin
| 4 bd · 3 ba · sleeps 9 | $36,541 | $384 | 26% | 4.9★ (190) | 0.3 mi | AirbnbVrbo |
Huckleberry Inn: Sweet Stays in the Smokies Cabin
| 4 bd · 5 ba · sleeps 12 | $73,244 | $448 | 45% | 5★ (2) | 0.3 mi | AirbnbVrbo |
The Big View by American Patriot Getaways Vacation home | 4 bd · 4 ba · sleeps 10 | $127,396 | $497 | 70% | — | 0.4 mi | Booking |
Beautiful Smoky Mountain Views! | Hot Tub | Games Cabin
| 4 bd · 3 ba · sleeps 12 | $83,383 | $328 | 70% | 4.8★ (170) | 0.4 mi | AirbnbVrbo |
Views - Sleeps 10 - Community Pool Cabin
| 4 bd · 4 ba · sleeps 10 | $84,938 | $444 | 52% | 4.2★ (4) | 0.4 mi | AirbnbVrbo |
Smoky Mountain | Hot Tub | Game Room | Sleeps 12 House
| 4 bd · 4 ba · sleeps 12 | $90,096 | $524 | 47% | 5★ (16) | 0.5 mi | AirbnbVrbo |
Mountain Views (Cabin) Cabin
| 4 bd · 3 ba · sleeps 10 | $51,070 | $329 | 43% | 4.4★ (29) | 0.5 mi | AirbnbVrbo |
Glorious Views:Views*Hot Tub* Wifi*Great Location Cabin
| 4 bd · 3 ba · sleeps 12 | $130,218 | $587 | 61% | 4.5★ (27) | 0.5 mi | AirbnbVrbo |
Show 10 more
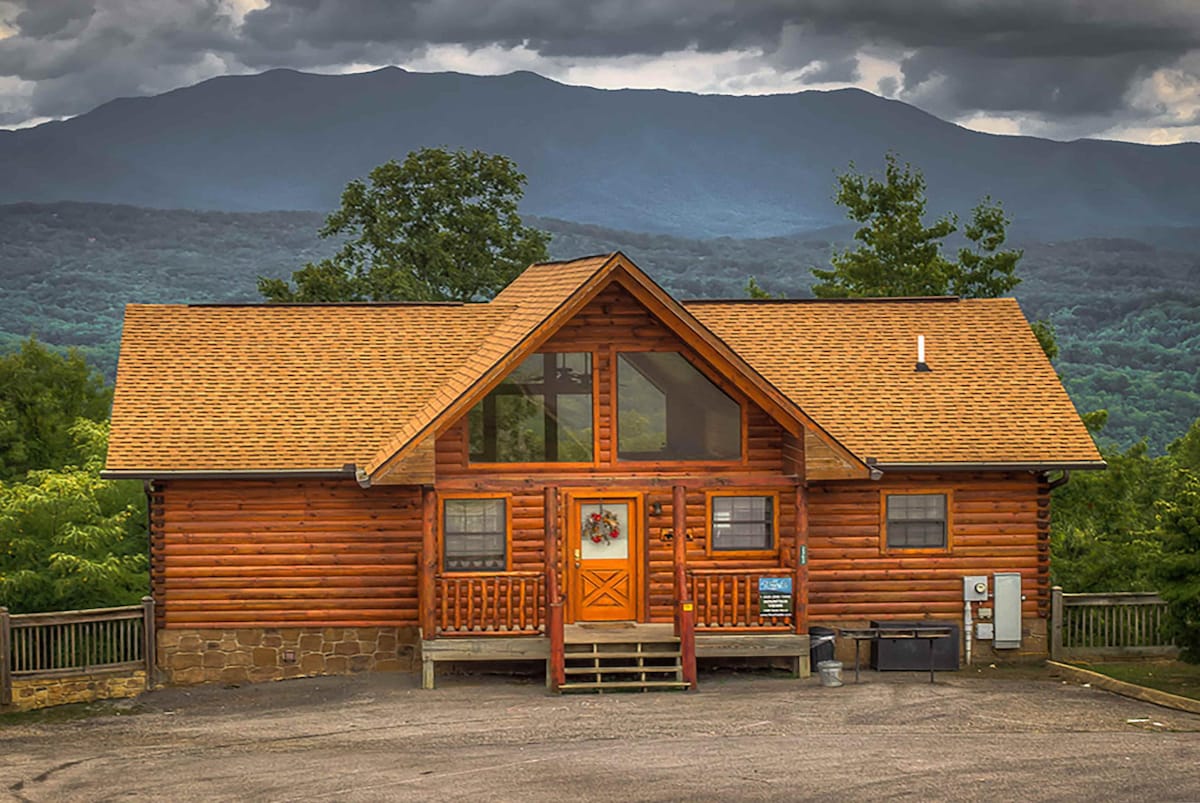
Mountain Views: Views*Resort Pool*Hot Tub*Wifi
Cabin · 4 bd · 3 ba · sleeps 10 · 0.6 mi
- Hot tub
- A/C
- Free parking
- Wifi
- +4
Revenue $54,978ADR $372Occ ≈ 40%4★ (1)
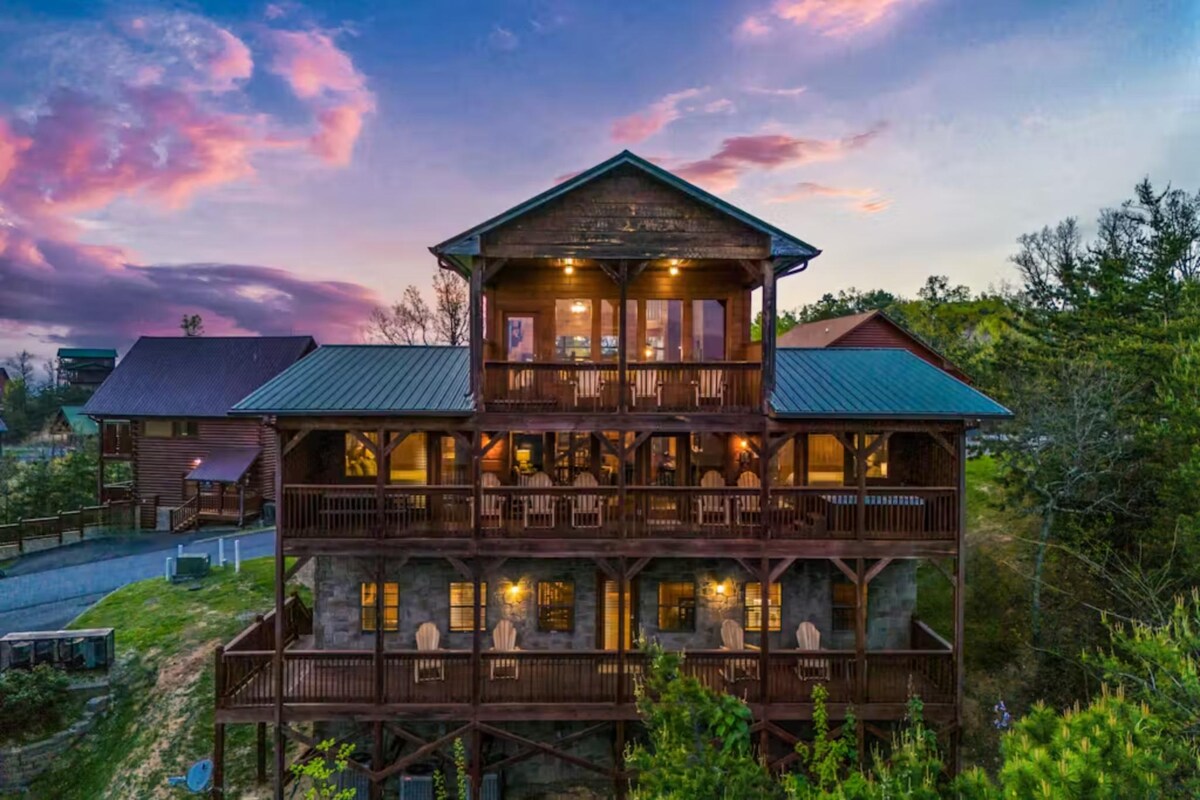
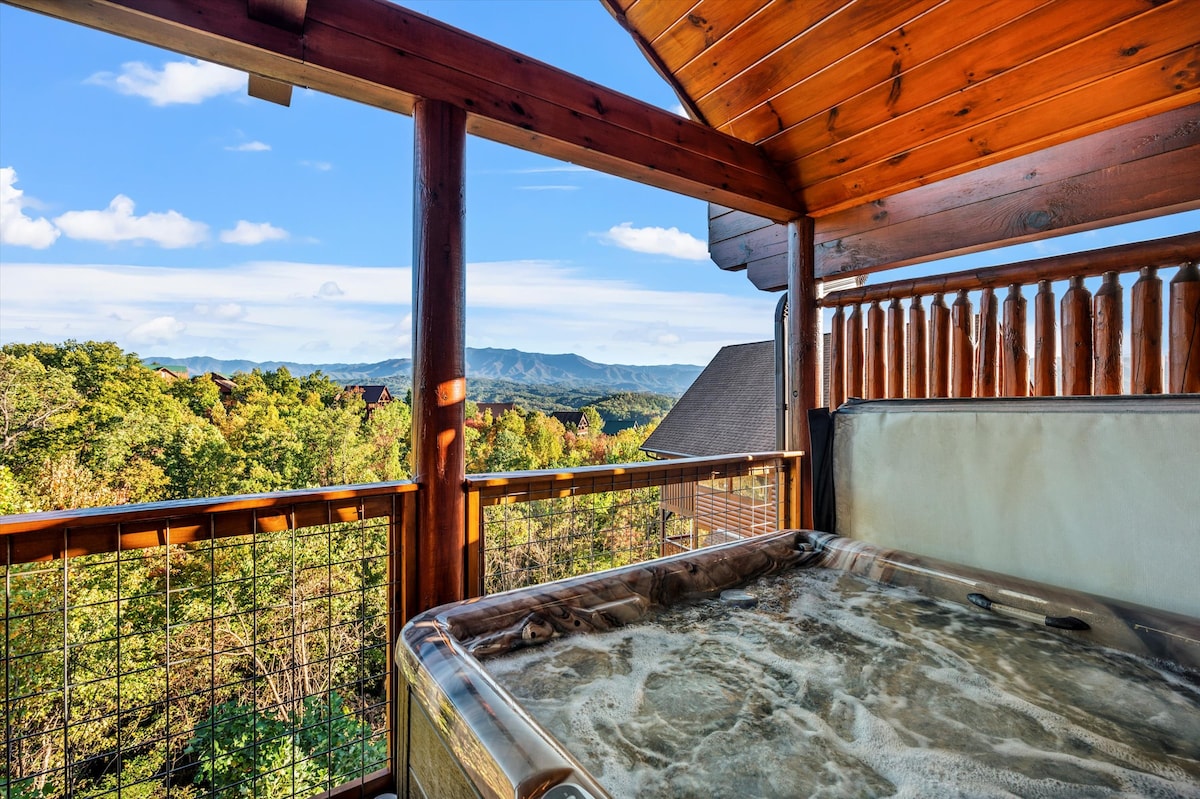
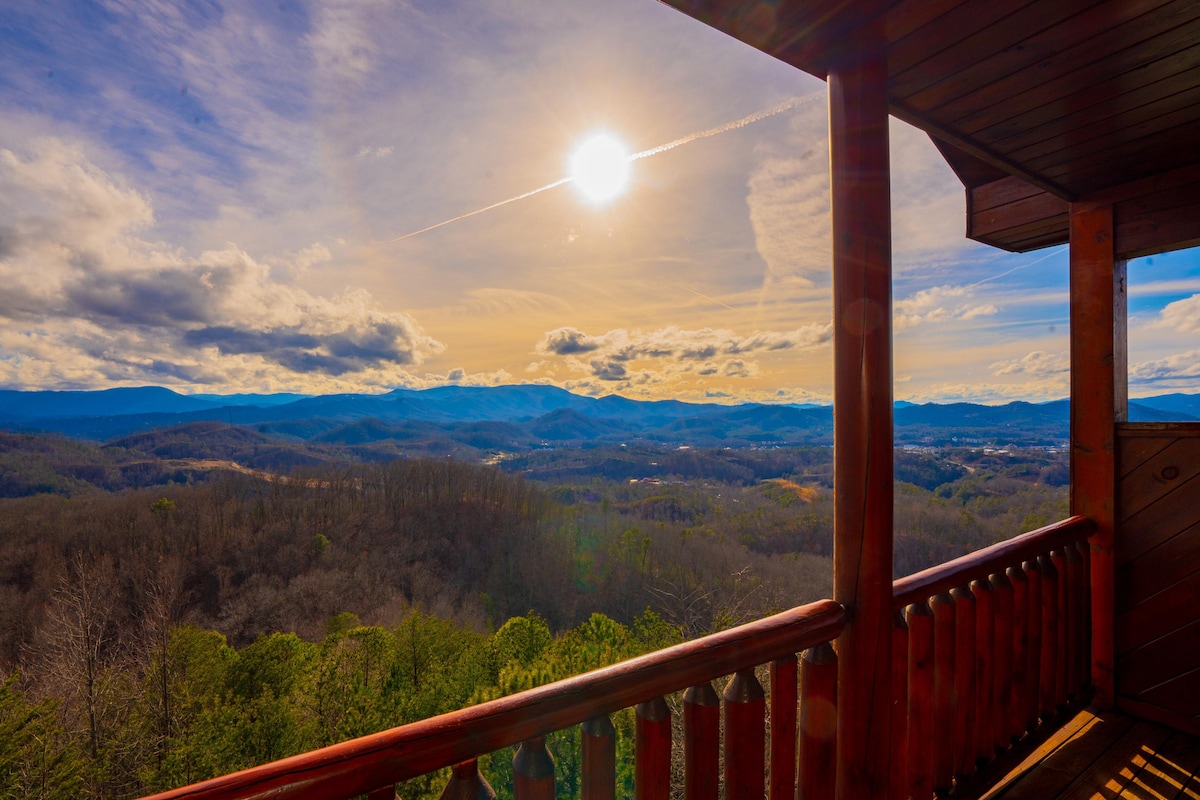

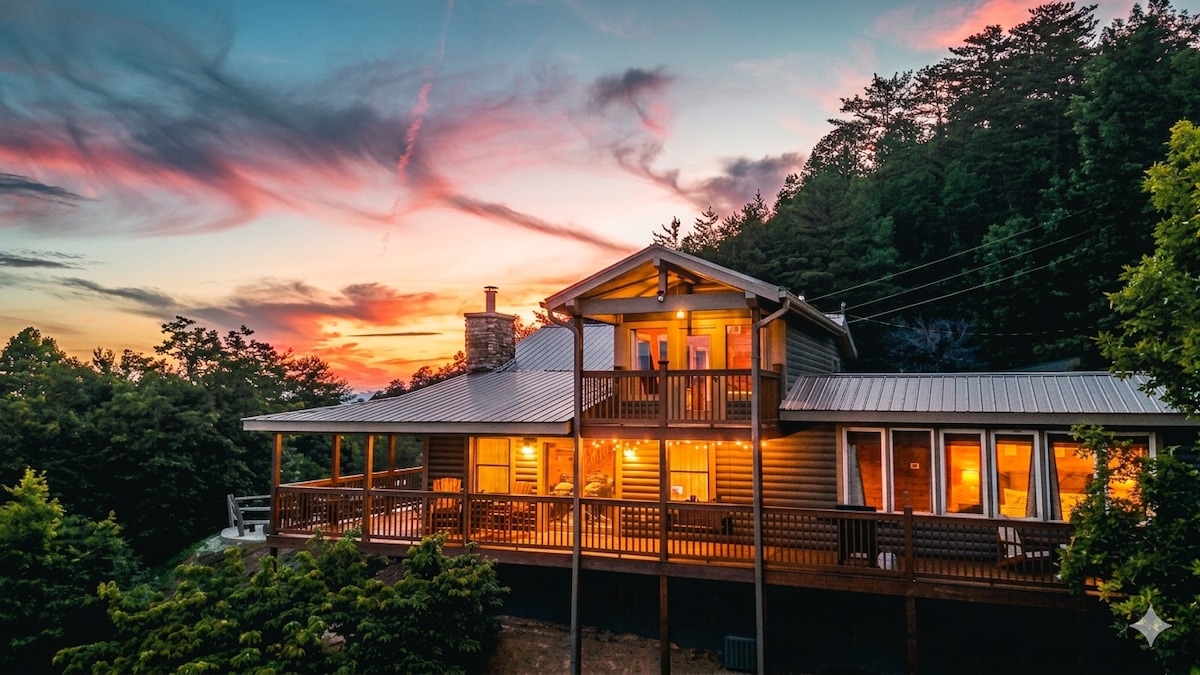
Secluded Mnt View | Sleeps 10 | Arcade | Hot Tub
Cabin · 4 bd · 4 ba · sleeps 10 · 0.7 mi
- Hot tub
- A/C
- Free parking
- Wifi
- +4
Revenue $25,043ADR $359Occ ≈ 19%5★ (10)
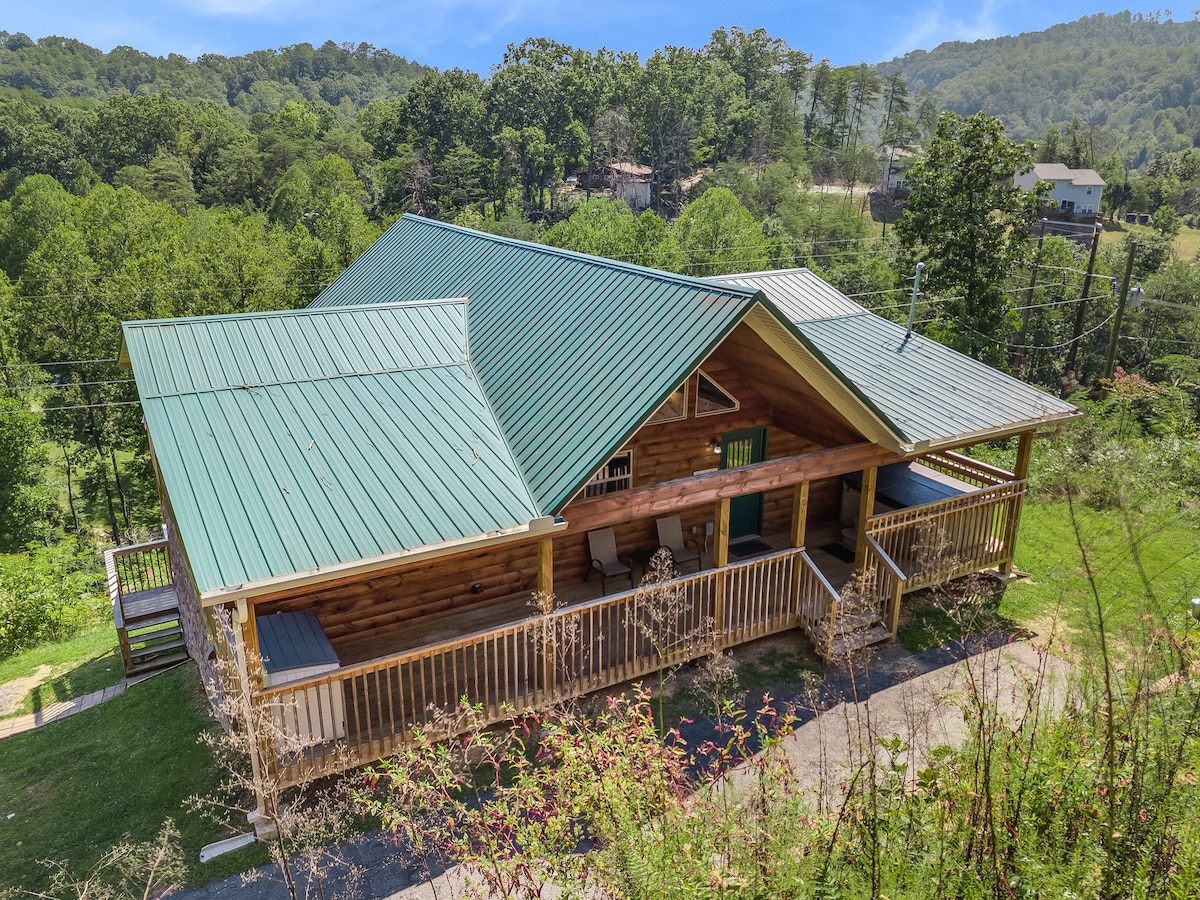
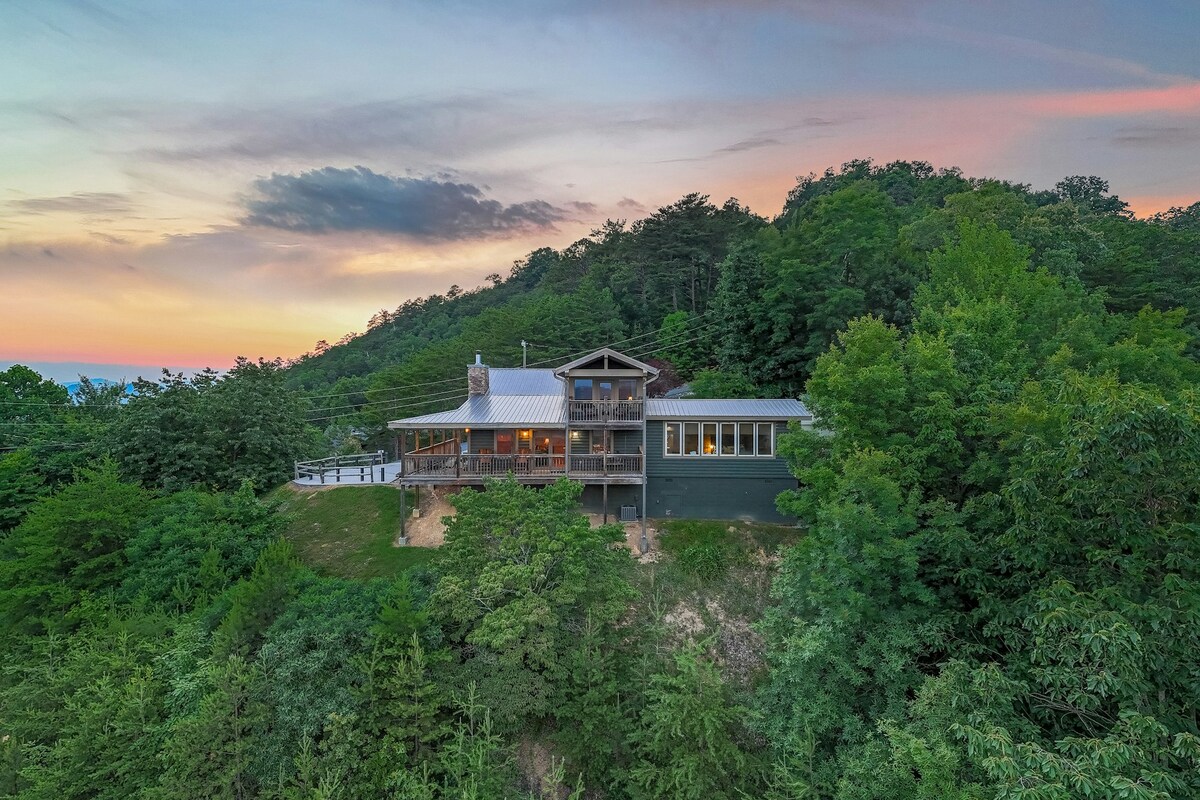

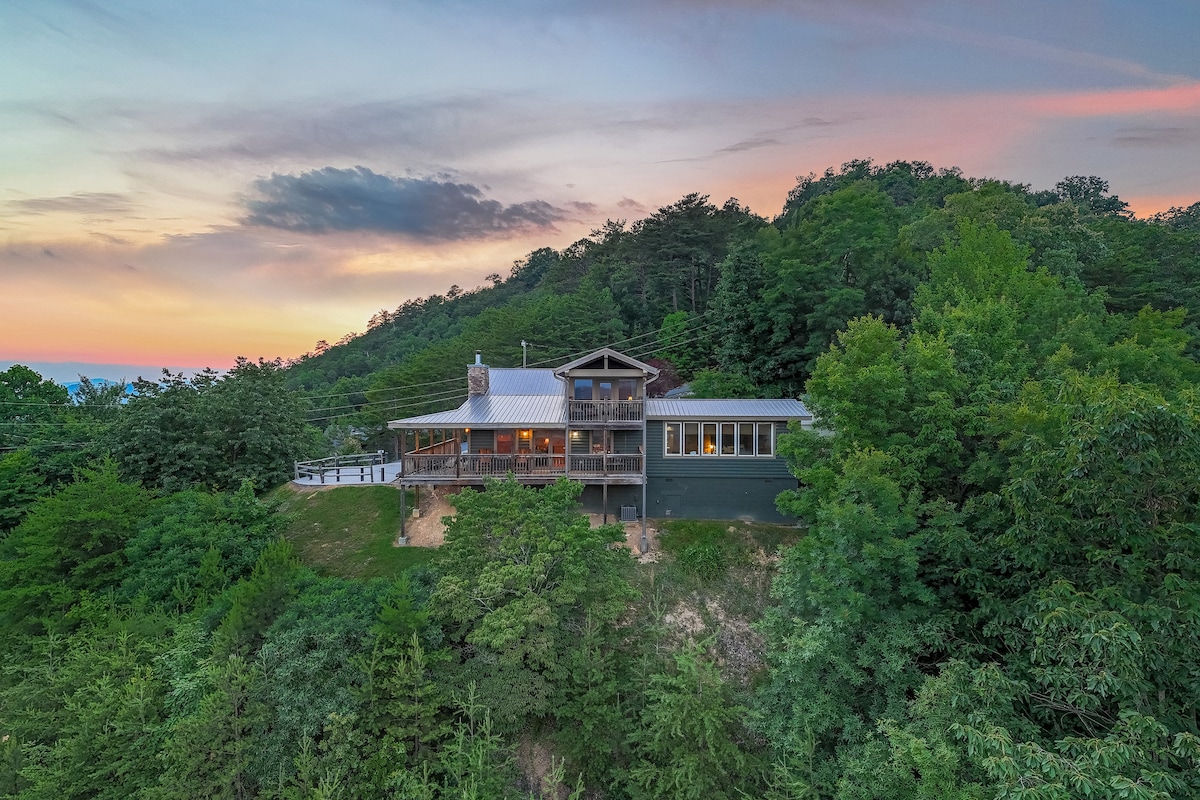
Wilderness cabin w/ hot tub, views, chef's kitchen
Cabin · 4 bd · 4 ba · sleeps 10 · 0.7 mi
Revenue $47,404ADR $0Occ ≈ —4.8★ (27)
| Listing | Size | Revenue (12 mo) | ADR | Occ ≈ | Rating | Distance | Links |
|---|---|---|---|---|---|---|---|
Mountain Views: Views*Resort Pool*Hot Tub*Wifi Cabin
| 4 bd · 3 ba · sleeps 10 | $54,978 | $372 | 40% | 4★ (1) | 0.6 mi | Airbnb |
Grand View Lodge - 3 bedroom Pigeon Forge cabin w Cabin
| 4 bd · 4 ba · sleeps 12 | $64,538 | $413 | 43% | 5★ (13) | 0.6 mi | AirbnbVrbo |
4BR w/Mountain Views! Hot Tub*Game Room*Fireplace Cabin
| 4 bd · 3 ba · sleeps 12 | $93,587 | $387 | 66% | 5★ (33) | 0.6 mi | AirbnbVrbo |
AHomeForTheStarrs: Views*Resort Pool*HotTub*Wifi Cabin
| 4 bd · 4.5 ba · sleeps 10 | $121,169 | $531 | 63% | 3.9★ (6) | 0.7 mi | AirbnbVrbo |
Fuzzy's Amazing View⛰, Great Location, 4 KING Beds Cabin
| 4 bd · 4 ba · sleeps 12 | $137,813 | $425 | 89% | 4.8★ (288) | 0.7 mi | AirbnbVrbo |
Secluded Mnt View | Sleeps 10 | Arcade | Hot Tub Cabin
| 4 bd · 4 ba · sleeps 10 | $25,043 | $359 | 19% | 5★ (10) | 0.7 mi | Airbnb |
Emily's Hideaway | Mtn Views, Hot Tub, Pool Table Cabin | 4 bd · 4 ba · sleeps 11 | $123,872 | $349 | 97% | 4.7★ (67) | 0.7 mi | AirbnbBooking |
Mtn home w/ chef kitchen & free attraction tickets Cabin | 4 bd · 4 ba · sleeps 10 | $1,139 | $394 | 1% | 4.6★ (17) | 0.7 mi | AirbnbBooking |
Grand Mtn Retreat: Views, Hot Tub & Theater Cabin
| 4 bd · 3 ba · sleeps 10 | $83,774 | $356 | 64% | 4.8★ (226) | 0.7 mi | AirbnbVrbo |
Wilderness cabin w/ hot tub, views, chef's kitchen Cabin | 4 bd · 4 ba · sleeps 10 | $47,404 | $0 | — | 4.8★ (27) | 0.7 mi | Airbnb |
Revenue and nightly rate (ADR) are trailing-12-month figures per listing. Occupancy is estimated as revenue ÷ ADR ÷ 365 and can read high when revenue includes cleaning fees.
Cash flow calculator
Est. revenue
$78,655
NOI
$47,398
Cash flow /mo
$3,950
Cash needed
$688,548
Cash-on-cash (all cash)
6.9%
ROE (yr 1)
9.7%
Cap rate
7.4%
DSCR
—
Year-1 write-off
$188,549
Year-1 tax shield @ 32%
$60,336
Year-1 return on equity
- Cash flow (annual)$47,398
- Principal paydown (n/a, cash)$0
- Appreciation at%$19,199
Tax savings aren't counted. Turn on “Count tax savings in returns” above if you can use the losses.
Opex, cash-needed & tax-savings breakdown
Annual operating expenses
- Management (20% of revenue)$15,731
- Platform fees (3% of revenue)$2,360
- Maintenance / capex (5% of revenue)$3,933
- Utilities & supplies$4,200
- HOA$0
- Property tax$1,194
- Insurance (STR-rated)$3,840
Cash needed to close
- Purchase price (all cash)$639,950
- Closing costs (4.0%)$25,598
- Furnishing (bought new)$23,000
Tax savings if the STR loophole applies
- Tax shield @ 32%$60,336
Property tax, insurance rate and the land/building split come from this listing's county tax record; other assumptions match the daily feed (see tasks/plan.md).
The write-off comes from the cost segregation estimate below. Not tax advice.
Cost segregation estimate
An estimate from the listing: every part of the home is priced from national construction costs, less wear for age, and the price (less land) is spread over the parts in proportion. The headline is what a typical cost seg study would claim for this property. The answers below are optional refinements.
Depreciable basis
$592,000
Short-life (5/15-yr)
$165,000 · 28%
Year-1 deduction
$189,000
Year-1 tax shield @ 32%
$60,000
Land 7% (county tax record, market value split) · building $427,000 over 39 years · new furniture $23,000
Based on: 2,464 sq ft, built 1980, 4 bd / 4 ba, unfurnished, listing features (hot tub, deck, fireplace, flooring types, appliance list, septic).
Try the cost segregation calculator on any property →
IRS-guide safe-harbor floor: $117,000 in year 1 (16% short-life, $38,000 tax shield), the conservative amount following the IRS audit guide's residential classification table.
- $13,000
Kitchen cabinetsdefault
$11,200 new × 40% good × 2.90 allocation
- $10,600
Kitchen countertopsdefault
$9,200 new × 40% good × 2.90 allocation
- $5,000
Decorative trimdefault
$4,300 new × 40% good × 2.90 allocation
- $700
Mirrorsdefault
$600 new × 40% good × 2.90 allocation
- $1,700
Shelvingdefault
$1,500 new × 40% good × 2.90 allocation
- $7,200
Window coverings (25)default
$6,300 new × 40% good × 2.90 allocation
- $18,400
Carpet, vinyl & laminate (100% of floors)listing
$15,900 new × 40% good × 2.90 allocation
- $10,100
Kitchen & laundry equipment plumbingdefault
$8,700 new × 40% good × 2.90 allocation
- $6,100
Kitchen, laundry & data equipment electricaldefault
$5,300 new × 40% good × 2.90 allocation
- $8,900
Appliances (range, microwave, dishwasher, refrigerator, washer, dryer)listing
$7,700 new × 40% good × 2.90 allocation
- $10,400
Hot tub (freestanding)listing
$9,000 new × 40% good × 2.90 allocation
- $23,000
Furniture bought newlisting
$23,000 new × 100% good · bought separately
- $14,900
Paving: driveway & walks (paved)listing
$10,300 new × 50% good × 2.90 allocation
- $14,300
Landscaping (typical)default
$9,900 new × 50% good × 2.90 allocation
- $3,500
Patiosdefault
$2,400 new × 50% good × 2.90 allocation
- $40,100
Decks & porches (attached)listing
$27,700 new × 50% good × 2.90 allocation
- $309,500
Structure: foundation, framing, walls, windows, doors, roof, interior finishesdefault
$267,100 new × 40% good × 2.90 allocation
- $32,200
Building plumbing & fixturesdefault
$27,800 new × 40% good × 2.90 allocation
- $33,000
Building electrical & lightingdefault
$28,500 new × 40% good × 2.90 allocation
- $32,200
HVACdefault
$27,800 new × 40% good × 2.90 allocation
- $3,000
Fireplacelisting
$2,600 new × 40% good × 2.90 allocation
- $17,400
Septic systemlisting
$12,000 new × 50% good × 2.90 allocation
About the property
Depreciation schedule: typical cost seg study
| Year | 5-yr | 15-yr | Building | Total |
|---|---|---|---|---|
| 1 | $115,200 | $72,900 | $500 | $188,500 |
| 2 | $0 | $0 | $11,000 | $11,000 |
| 3 | $0 | $0 | $11,000 | $11,000 |
| 4 | $0 | $0 | $11,000 | $11,000 |
| 5 | $0 | $0 | $11,000 | $11,000 |
| 6+ | $0 | $0 | $383,000 | $383,000 |
| Total | $115,200 | $72,900 | $427,300 | $615,400 |
Model-based estimate, not an engineered cost segregation study. The IRS doesn’t approve studies; get a professional study before filing. Using these losses against W-2 income needs the short-term rental exception (average stay ≤7 days + material participation). The 39-year building life applies because stays average under 30 days, a separate test (27.5 years for a long-term rental). Federal only: California, Georgia and Wisconsin disallow bonus depreciation, Ohio adds back 5/6 of it, and Tennessee has no personal income tax. Not tax advice.
Market note
STR allowed in most of Sevier County; inside Gatlinburg city limits only in overnight-rental zones.