
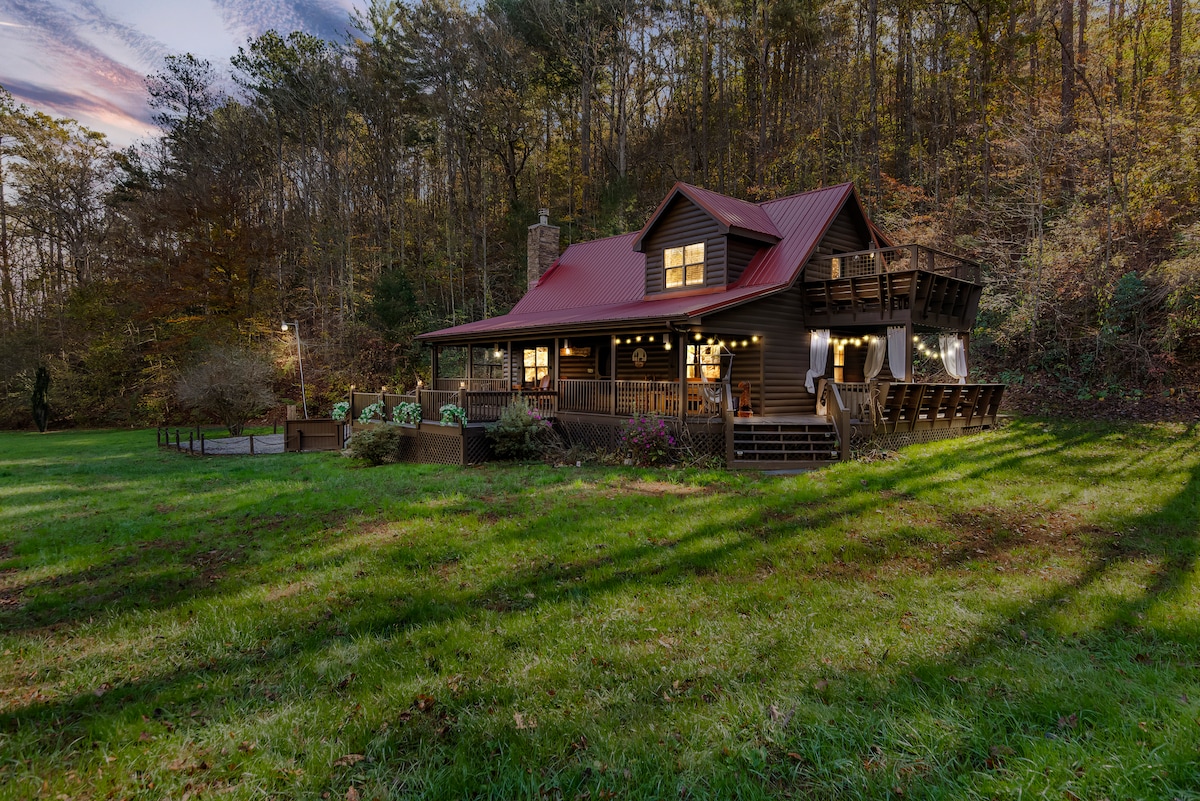
242 Sunset Cv
Ellijay, GA 30540
$499,900
3 bd · 2 ba · 1,765 sqft · Listed 7d ago
View on Realtor.com →Year built
2021
Sqft
1,765
Lot sqft
42,689
HOA / mo
$50
Furnished
No
List date
2026-11-05T18:57:40.000000Z
Revenue
Annual revenue
$29,416
ADR
$172
Occupancy
47%
Cleaning fees (12 mo)
$6,000
Confidence
Low (30.51), 6 comps
Comp revenue range (p25 / median / p75)
Few similar-size comps were found, so all comps are shown.
Median revenue of shown comps: $22,131
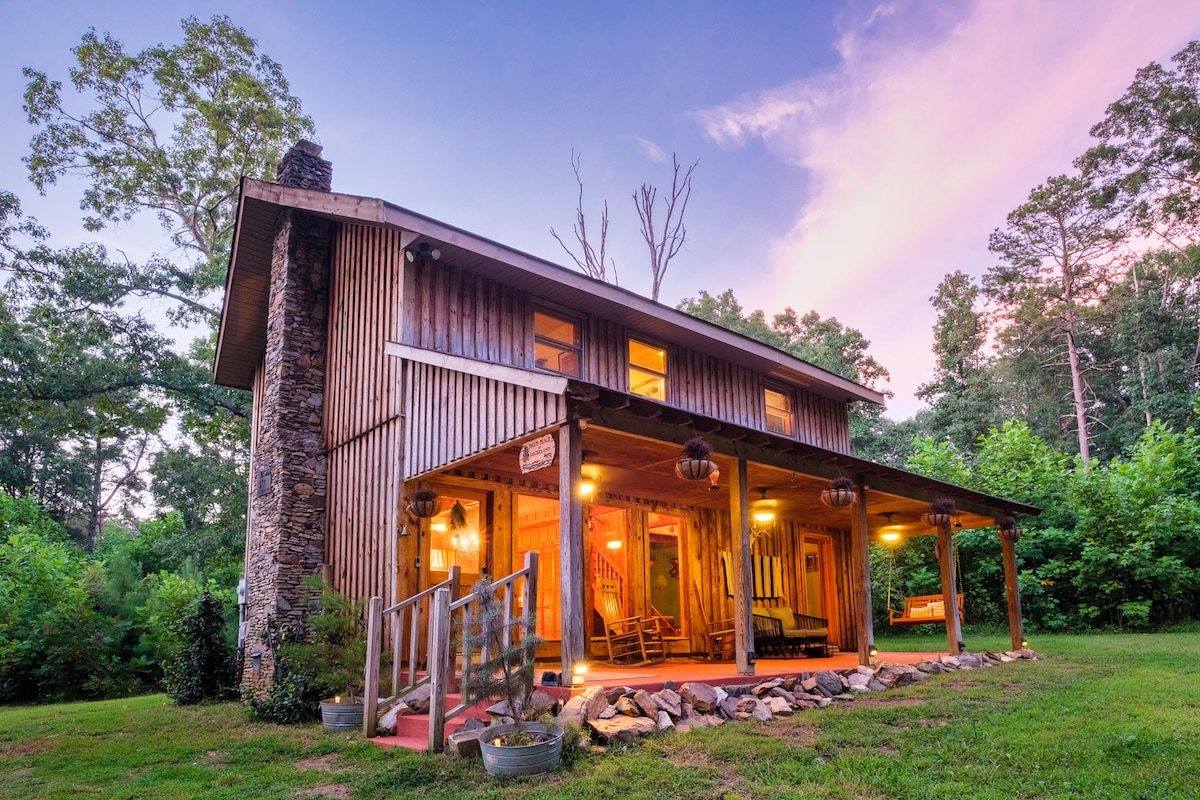
Cajun Hideaway Retreat
Cabin · 2 bd · 2 ba · sleeps 4 · 1.2 mi
- A/C
- Pets OK
- Wifi
- Kitchen
- +2
Revenue $5,440ADR $158Occ ≈ 9%4.5★ (21)

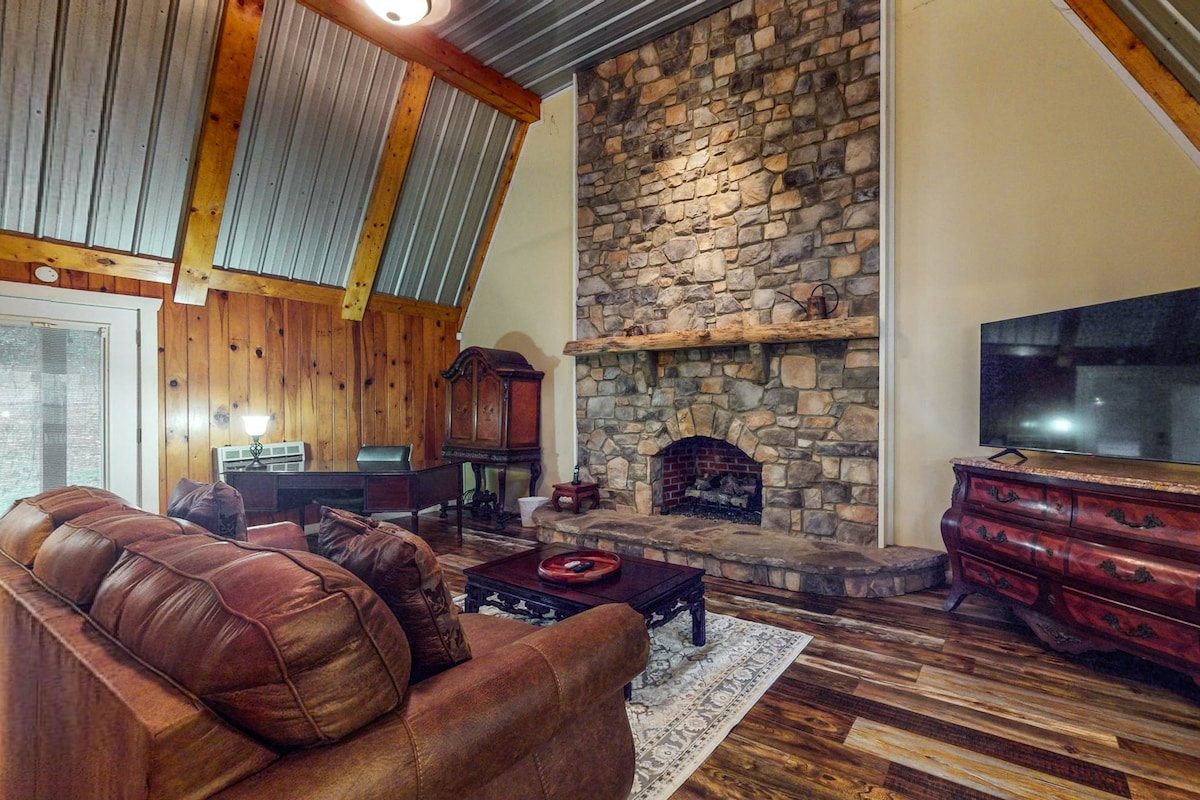
Charming log cabin with serene views, private pond, & cozy fireplace
Cabin · 2 bd · 2 ba · sleeps 4 · 1.3 mi
Revenue $20,420ADR $145Occ ≈ 39%4.7★ (10)
Delisted
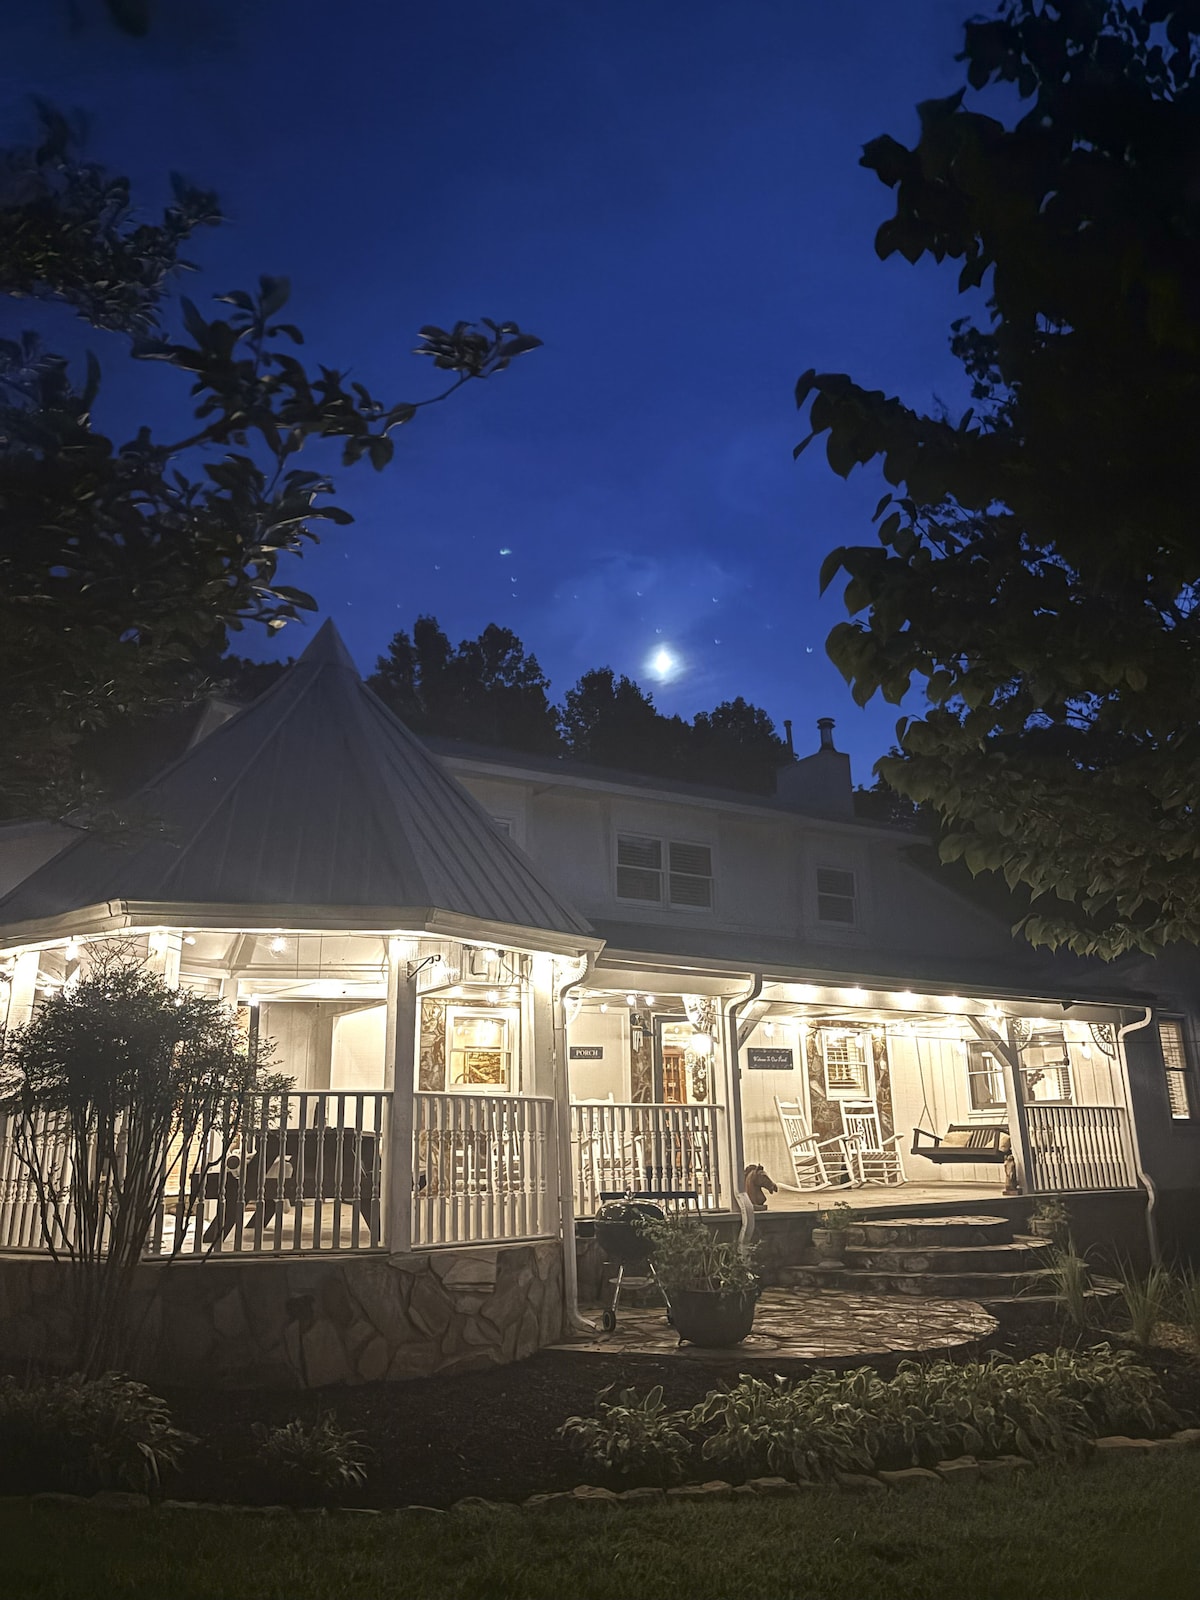
Pondside Porch House
House · 4 bd · 2 ba · sleeps 10 · 1.7 mi
- A/C
- Free parking
- Pets OK
- Wifi
- +4
Revenue $48,054ADR $225Occ ≈ 59%5★ (186)
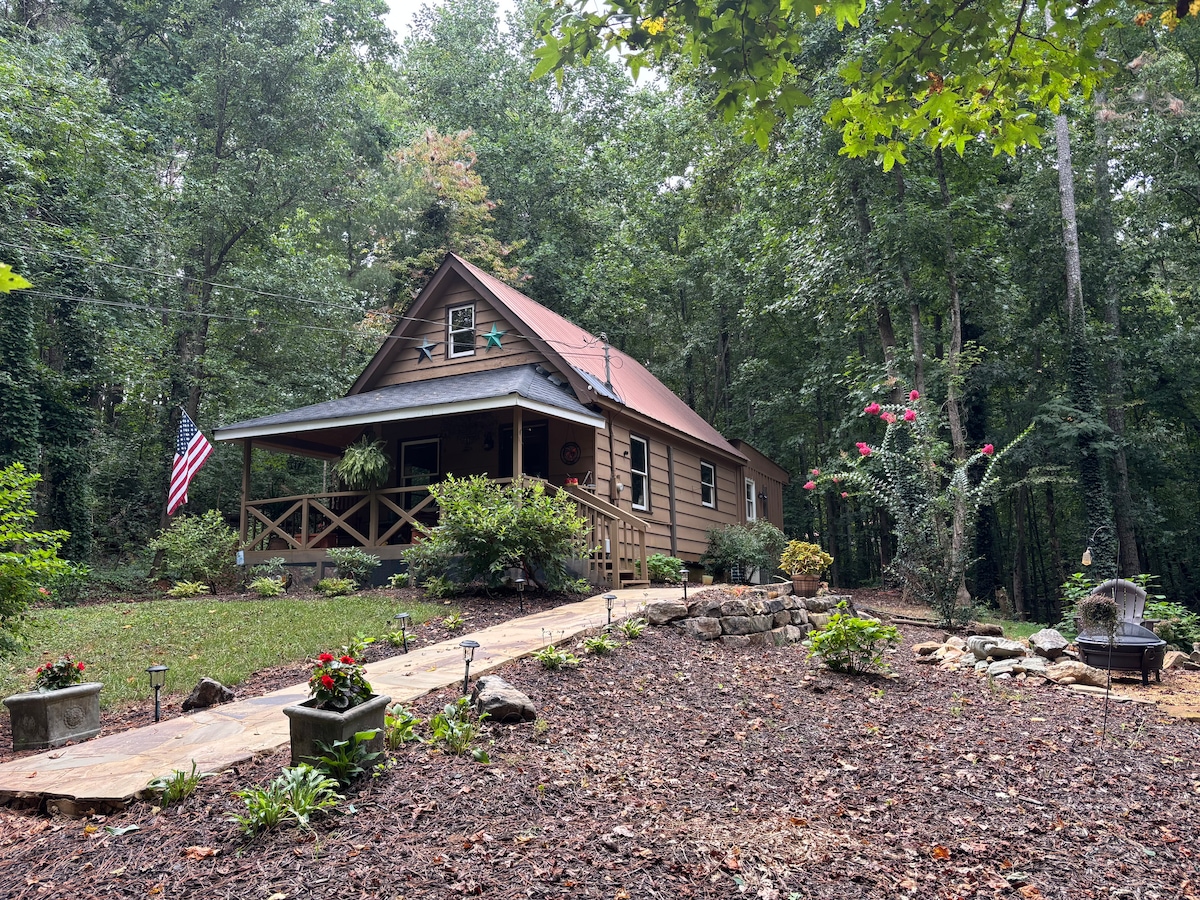
Precious cabin in Ellijay!
Cabin · 2 bd · 1 ba · sleeps 3 · 1.9 mi
- A/C
- Free parking
- Wifi
- Kitchen
Revenue $9,295ADR $140Occ ≈ 18%4.8★ (22)
Honeys Hideaway-Private Trout Pond on 7acres ʕ•ᴥ•ʔ
Cabin · 2 bd · 2 ba · sleeps 6 · 2.0 mi
Revenue $43,178ADR $175Occ ≈ 68%5★ (141)
| Listing | Size | Revenue (12 mo) | ADR | Occ ≈ | Rating | Distance | Links |
|---|---|---|---|---|---|---|---|
StackRock Cabin-An Exclusive Retreat Cabin
| 2 bd · 1 ba · sleeps 4 | $23,841 | $187 | 35% | 4.8★ (234) | 0.6 mi | AirbnbVrbo |
Cajun Hideaway Retreat Cabin
| 2 bd · 2 ba · sleeps 4 | $5,440 | $158 | 9% | 4.5★ (21) | 1.2 mi | Airbnb |
Charming log cabin with serene views, private pond, & cozy fireplace Cabin | 2 bd · 2 ba · sleeps 4 | $20,420 | $145 | 39% | 4.7★ (10) | 1.3 mi | Delisted |
Pondside Porch House House
| 4 bd · 2 ba · sleeps 10 | $48,054 | $225 | 59% | 5★ (186) | 1.7 mi | Airbnb |
Precious cabin in Ellijay! Cabin
| 2 bd · 1 ba · sleeps 3 | $9,295 | $140 | 18% | 4.8★ (22) | 1.9 mi | Airbnb |
Honeys Hideaway-Private Trout Pond on 7acres ʕ•ᴥ•ʔ Cabin | 2 bd · 2 ba · sleeps 6 | $43,178 | $175 | 68% | 5★ (141) | 2.0 mi | Airbnb |
Revenue and nightly rate (ADR) are trailing-12-month figures per listing. Occupancy is estimated as revenue ÷ ADR ÷ 365 and can read high when revenue includes cleaning fees.
Cash flow calculator
Rate 7.93% = 7.18% Freddie Mac 30-yr avg (Nov 5) + 0.75% investor premium
Est. revenue
$29,416
NOI
$8,318
Cash flow /mo
-$2,040
Cash needed
$164,471
Cash-on-cash
-14.9%
ROE (yr 1)
-3.8%
Cap rate
1.7%
DSCR
0.25
Year-1 write-off
$116,692
Year-1 tax shield @ 32%
$37,341
Year-1 return on equity
- Cash flow (annual)-$24,476
- Principal paydown$3,176
- Appreciation at%$14,997
Tax savings aren't counted. Turn on “Count tax savings in returns” above if you can use the losses.
Opex, cash-needed & tax-savings breakdown
Annual operating expenses
- Management (20% of revenue)$5,883
- Platform fees (3% of revenue)$882
- Maintenance / capex (5% of revenue)$1,471
- Utilities & supplies$4,200
- HOA$600
- Property tax$2,663
- Insurance (STR-rated)$5,399
Cash needed to close
- Down payment (25%)$124,975
- Closing costs (4.0%)$19,996
- Furnishing (bought new)$19,500
Tax savings if the STR loophole applies
- Tax shield @ 32%$37,341
Property tax, insurance rate and the land/building split come from this listing's county tax record; other assumptions match the daily feed (see tasks/plan.md).
The write-off comes from the cost segregation estimate below. Not tax advice.
Cost segregation estimate
An estimate from the listing: every part of the home is priced from national construction costs, less wear for age, and the price (less land) is spread over the parts in proportion. The headline is what a typical cost seg study would claim for this property. The answers below are optional refinements.
Depreciable basis
$453,000
Short-life (5/15-yr)
$97,000 · 21%
Year-1 deduction
$117,000
Year-1 tax shield @ 32%
$37,000
Land 9% (county tax record, market value split) · building $356,000 over 39 years · new furniture $20,000
Based on: 1,765 sq ft, built 2021, 3 bd / 2 ba, unfurnished, listing features (deck, fireplace, stone counters, appliance list, wooded lot).
Try the cost segregation calculator on any property →
IRS-guide safe-harbor floor: $65,000 in year 1 (10% short-life, $21,000 tax shield), the conservative amount following the IRS audit guide's residential classification table.
- $11,800
Kitchen cabinetsdefault
$9,700 new × 80% good × 1.52 allocation
- $12,100
Kitchen countertops (stone)listing
$9,900 new × 80% good × 1.52 allocation
- $3,800
Decorative trimdefault
$3,100 new × 80% good × 1.52 allocation
- $300
Mirrorsdefault
$300 new × 58% good × 1.52 allocation
- $1,500
Shelvingdefault
$1,200 new × 80% good × 1.52 allocation
- $3,400
Window coverings (18)default
$4,500 new × 50% good × 1.52 allocation
- $4,000
Carpet, vinyl & laminate (40% of floors)default
$4,500 new × 58% good × 1.52 allocation
- $10,300
Kitchen & laundry equipment plumbingdefault
$7,500 new × 90% good × 1.52 allocation
- $6,200
Kitchen, laundry & data equipment electricaldefault
$4,500 new × 90% good × 1.52 allocation
- $2,800
Appliances (dishwasher, refrigerator)listing
$3,200 new × 58% good × 1.52 allocation
- $19,500
Furniture bought newlisting
$19,500 new × 100% good · bought separately
- $10,600
Paving: driveway & walks (paved)default
$8,700 new × 80% good × 1.52 allocation
- $5,100
Landscaping (minimal)listing
$4,200 new × 80% good × 1.52 allocation
- $2,100
Patiosdefault
$1,700 new × 80% good × 1.52 allocation
- $22,700
Decks & porches (attached)listing
$19,900 new × 75% good × 1.52 allocation
- $267,500
Structure: foundation, framing, walls, windows, doors, roof, interior finishesdefault
$191,400 new × 92% good × 1.52 allocation
- $27,200
Building plumbing & fixturesdefault
$19,800 new × 90% good × 1.52 allocation
- $27,000
Building electrical & lightingdefault
$19,600 new × 90% good × 1.52 allocation
- $22,700
HVACdefault
$19,900 new × 75% good × 1.52 allocation
- $8,300
Hardwood & tile floorsdefault
$6,800 new × 80% good × 1.52 allocation
- $3,200
Fireplacelisting
$2,600 new × 80% good × 1.52 allocation
About the property
Depreciation schedule: typical cost seg study
| Year | 5-yr | 15-yr | Building | Total |
|---|---|---|---|---|
| 1 | $75,700 | $40,600 | $400 | $116,700 |
| 2 | $0 | $0 | $9,100 | $9,100 |
| 3 | $0 | $0 | $9,100 | $9,100 |
| 4 | $0 | $0 | $9,100 | $9,100 |
| 5 | $0 | $0 | $9,100 | $9,100 |
| 6+ | $0 | $0 | $319,100 | $319,100 |
| Total | $75,700 | $40,600 | $355,900 | $472,300 |
Model-based estimate, not an engineered cost segregation study. The IRS doesn’t approve studies; get a professional study before filing. Using these losses against W-2 income needs the short-term rental exception (average stay ≤7 days + material participation). The 39-year building life applies because stays average under 30 days, a separate test (27.5 years for a long-term rental). Federal only: California, Georgia and Wisconsin disallow bonus depreciation, Ohio adds back 5/6 of it, and Tennessee has no personal income tax. Not tax advice.
Market note
Fannin and Gilmer counties require STR registration and lodging tax; no cap found. Blue Ridge and Ellijay city limits have their own rules; most cabins are in unincorporated county.