
240 S Highway 5
Ellijay, GA 30540
$950
2 bd · 880 sqft · Listed today
View on Realtor.com →Year built
1987
Sqft
880
Lot sqft
—
HOA / mo
None
Furnished
No
List date
2026-11-03T03:36:22.000000Z
Revenue
Annual revenue
$16,079
ADR
$103
Occupancy
43%
Cleaning fees (12 mo)
$2,983
Confidence
Low (-7.65), 5 comps
Comp revenue range (p25 / median / p75)
Median revenue of shown comps: $6,292

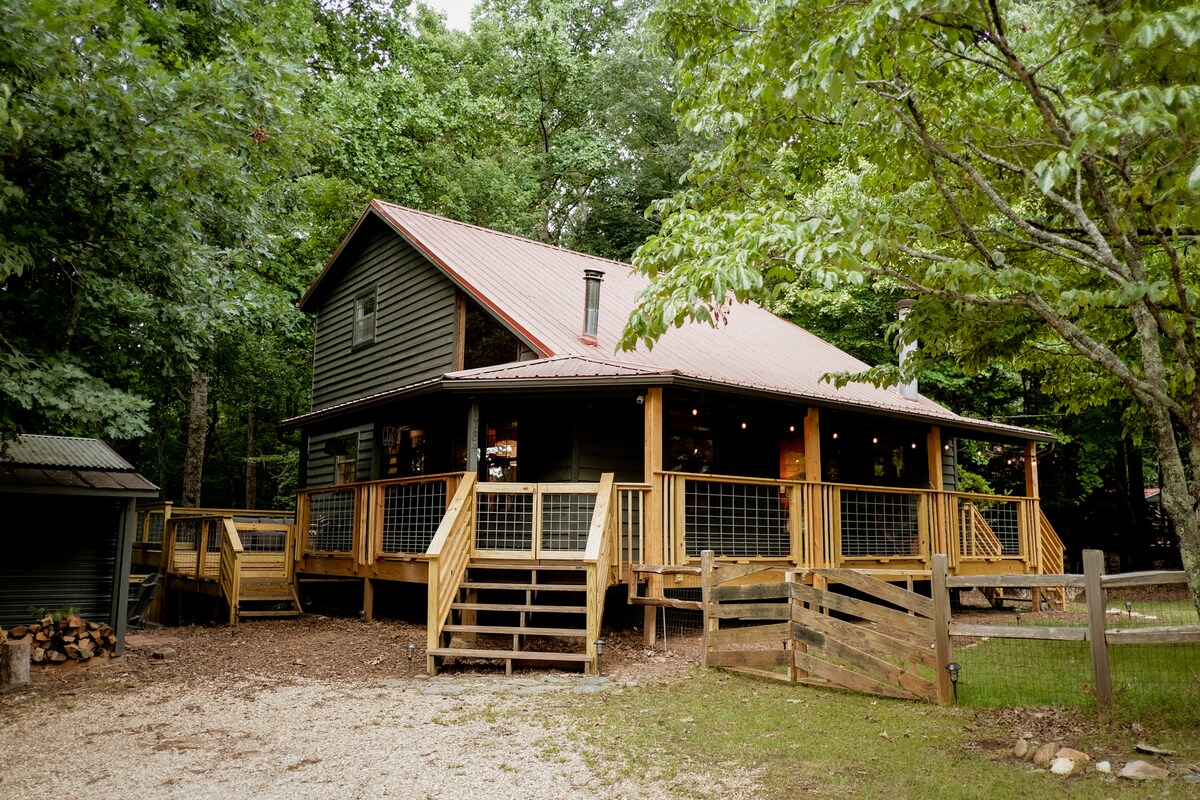
Ellijay Luxury Family Glamper! Indoor pool & deer
Tiny house · 2 bd · 1 ba · sleeps 4 · 0.3 mi
Revenue $22,460ADR $579Occ ≈ 11%4.8★ (28)
Delisted
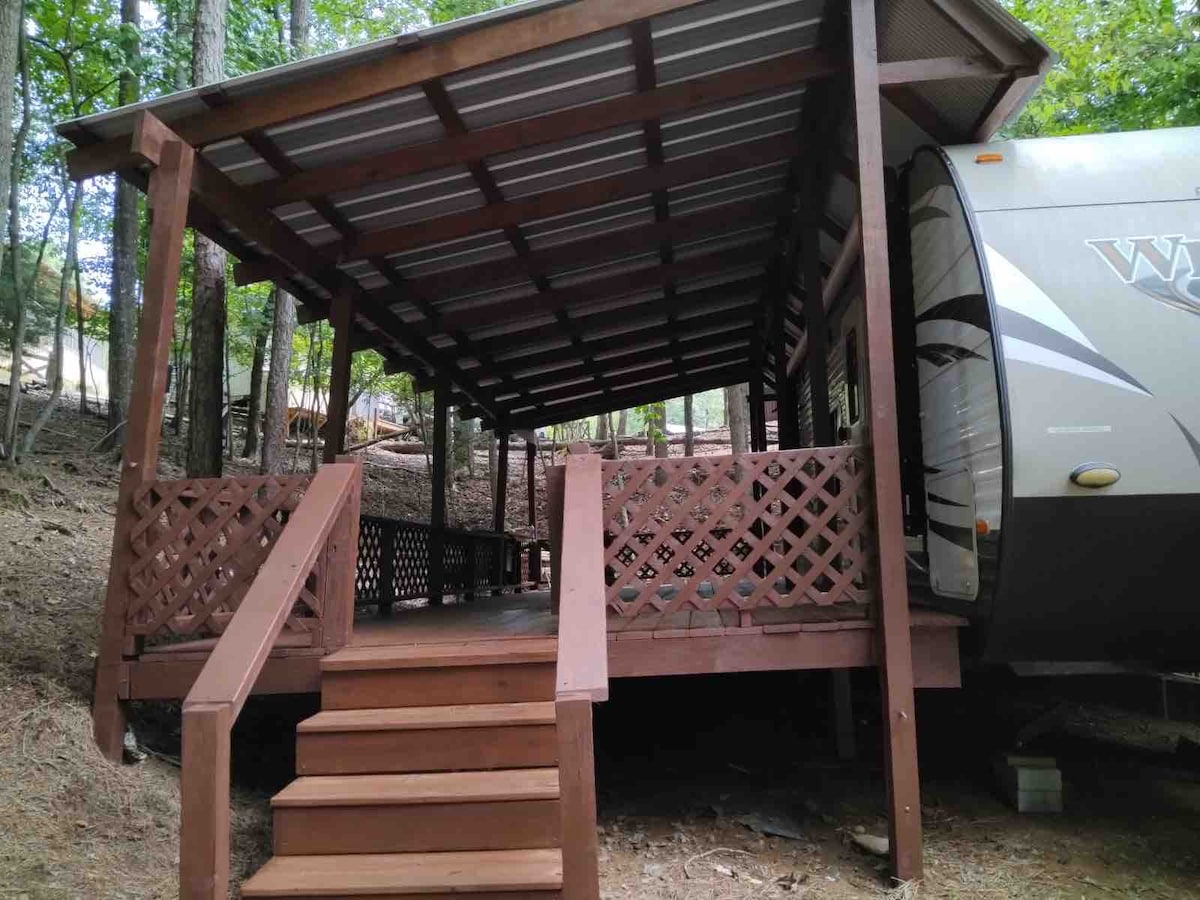
Care Bears Cottage
Camper/RV · 2 bd · 1 ba · sleeps 5 · 0.5 mi
- Pool
- A/C
- Free parking
- Pets OK
- +5
Revenue $1,452ADR $128Occ ≈ 3%4.8★ (12)

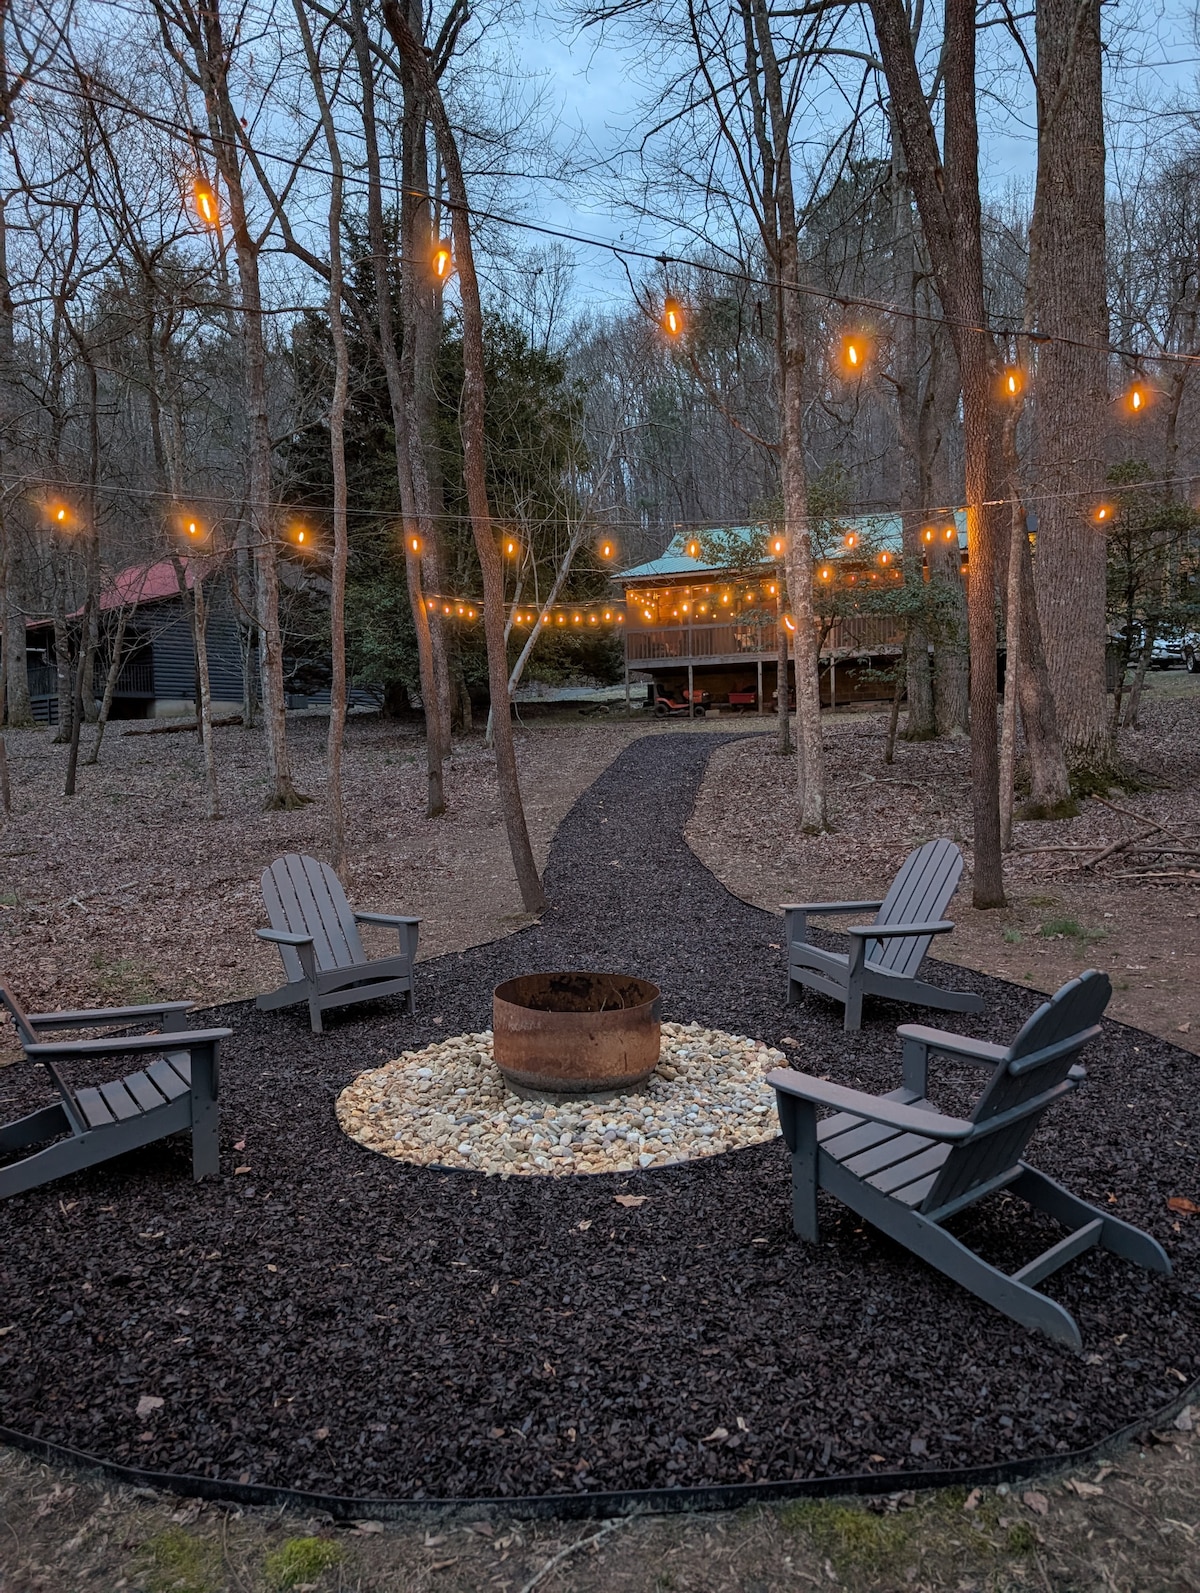
Relax camping in the mountains!
Camper/RV · 2 bd · 1 ba · sleeps 5 · 0.6 mi
Revenue $2,090ADR $172Occ ≈ 3%5★ (8)
Delisted
| Listing | Size | Revenue (12 mo) | ADR | Occ ≈ | Rating | Distance | Links |
|---|---|---|---|---|---|---|---|
Ellijay Luxury Family Glamper! Indoor pool & deer Tiny house | 2 bd · 1 ba · sleeps 4 | $22,460 | $579 | 11% | 4.8★ (28) | 0.3 mi | Delisted |
Care Bears Cottage Camper/RV
| 2 bd · 1 ba · sleeps 5 | $1,452 | $128 | 3% | 4.8★ (12) | 0.5 mi | Airbnb |
Modern Cabin, Forest Deck and Deer Everywhere Cabin
| 2 bd · 1 ba · sleeps 6 | $33,234 | $257 | 35% | 5★ (1) | 0.6 mi | AirbnbVrbo |
Relax camping in the mountains! Camper/RV | 2 bd · 1 ba · sleeps 5 | $2,090 | $172 | 3% | 5★ (8) | 0.6 mi | Delisted |
Cedar & Pine River Cabin Cabin
| 2 bd · 1 ba · sleeps 4 | $6,292 | $170 | 10% | 5★ (7) | 0.7 mi | AirbnbVrbo |
Revenue and nightly rate (ADR) are trailing-12-month figures per listing. Occupancy is estimated as revenue ÷ ADR ÷ 365 and can read high when revenue includes cleaning fees.
Cash flow calculator
Rate 7.99% = 7.24% Freddie Mac 30-yr avg (Oct 29) + 0.75% investor premium
Est. revenue
$16,079
NOI
$7,359
Cash flow /mo
$608
Cash needed
$16,276
Cash-on-cash
44.8%
ROE (yr 1)
45.0%
Cap rate
774.6%
DSCR
117.41
Year-1 write-off
$16,232
Year-1 tax shield @ 32%
$5,194
Year-1 return on equity
- Cash flow (annual)$7,296
- Principal paydown$6
- Appreciation at%$29
Tax savings aren't counted. Turn on “Count tax savings in returns” above if you can use the losses.
Opex, cash-needed & tax-savings breakdown
Annual operating expenses
- Management (20% of revenue)$3,216
- Platform fees (3% of revenue)$482
- Maintenance / capex (5% of revenue)$804
- Utilities & supplies$4,200
- HOA$0
- Property tax$8
- Insurance (STR-rated)$10
Cash needed to close
- Down payment (25%)$238
- Closing costs (4.0%)$38
- Furnishing (bought new)$16,000
Tax savings if the STR loophole applies
- Tax shield @ 32%$5,194
No county tax record split for property tax, insurance rate and the land/building split, so those use market defaults — edit the price above; other assumptions match the daily feed (see tasks/plan.md).
The write-off comes from the cost segregation estimate below. Not tax advice.
Cost segregation estimate
An estimate from the listing: every part of the home is priced from national construction costs, less wear for age, and the price (less land) is spread over the parts in proportion. The headline is what a typical cost seg study would claim for this property. The answers below are optional refinements.
Depreciable basis
$1,000
Short-life (5/15-yr)
$0 · 29%
Year-1 deduction
$16,000
Year-1 tax shield @ 32%
$5,000
Land 15% (market default, no usable tax-record split) · building $1,000 over 39 years · new furniture $16,000
Based on: 880 sq ft, built 1987, 2 bd, unfurnished, listing features (flooring types, appliance list, septic).
Try the cost segregation calculator on any property →
IRS-guide safe-harbor floor: $16,000 in year 1 (19% short-life, $5,000 tax shield), the conservative amount following the IRS audit guide's residential classification table.
- $0
Kitchen cabinetsdefault
$7,700 new × 40% good × 0.01 allocation
- $0
Kitchen countertopsdefault
$6,300 new × 40% good × 0.01 allocation
- $0
Decorative trimdefault
$1,500 new × 40% good × 0.01 allocation
- $0
Mirrorsdefault
$200 new × 40% good × 0.01 allocation
- $0
Shelvingdefault
$900 new × 40% good × 0.01 allocation
- $0
Window coverings (9)default
$2,300 new × 40% good × 0.01 allocation
- $0
Carpet, vinyl & laminate (100% of floors)listing
$5,700 new × 40% good × 0.01 allocation
- $0
Kitchen & laundry equipment plumbingdefault
$6,000 new × 40% good × 0.01 allocation
- $0
Kitchen, laundry & data equipment electricaldefault
$3,600 new × 40% good × 0.01 allocation
- $0
Appliances (range, refrigerator)listing
$4,000 new × 40% good × 0.01 allocation
- $16,000
Furniture bought newlisting
$16,000 new × 100% good · bought separately
- $0
Paving: driveway & walks (paved)default
$6,100 new × 50% good × 0.01 allocation
- $0
Landscaping (typical)default
$5,900 new × 50% good × 0.01 allocation
- $0
Patiosdefault
$900 new × 50% good × 0.01 allocation
- $0
Decks & porches (attached)default
$900 new × 50% good × 0.01 allocation
- $400
Structure: foundation, framing, walls, windows, doors, roof, interior finishesdefault
$95,100 new × 40% good × 0.01 allocation
- $0
Building plumbing & fixturesdefault
$9,800 new × 40% good × 0.01 allocation
- $0
Building electrical & lightingdefault
$8,400 new × 40% good × 0.01 allocation
- $0
HVACdefault
$9,900 new × 40% good × 0.01 allocation
- $100
Septic systemlisting
$12,000 new × 50% good × 0.01 allocation
About the property
Depreciation schedule: typical cost seg study
| Year | 5-yr | 15-yr | Building | Total |
|---|---|---|---|---|
| 1 | $16,200 | $100 | $0 | $16,200 |
| 2 | $0 | $0 | $0 | $0 |
| 3 | $0 | $0 | $0 | $0 |
| 4 | $0 | $0 | $0 | $0 |
| 5 | $0 | $0 | $0 | $0 |
| 6+ | $0 | $0 | $500 | $500 |
| Total | $16,200 | $100 | $600 | $16,800 |
The building's share of the price ($1,000) is well below our depreciated replacement cost of the home ($77,000). The land share may be overstated, or the home may need work.
Model-based estimate, not an engineered cost segregation study. The IRS doesn’t approve studies; get a professional study before filing. Using these losses against W-2 income needs the short-term rental exception (average stay ≤7 days + material participation). The 39-year building life applies because stays average under 30 days, a separate test (27.5 years for a long-term rental). Federal only: California, Georgia and Wisconsin disallow bonus depreciation, Ohio adds back 5/6 of it, and Tennessee has no personal income tax. Not tax advice.
Market note
Fannin and Gilmer counties require STR registration and lodging tax; no cap found. Blue Ridge and Ellijay city limits have their own rules; most cabins are in unincorporated county.